Food Web and Energy Flow Generator
Free online Food Web and Energy Flow generator: get a fully labeled figure in about 90 seconds. The AI plans the must-have label list first, then renders a clean textbook-style diagram — every label editable afterwards, ready for papers, assignments and slides.
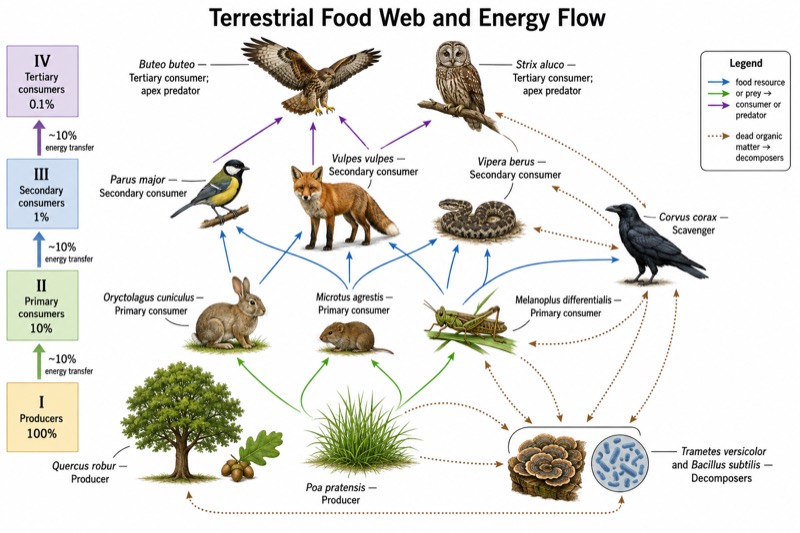
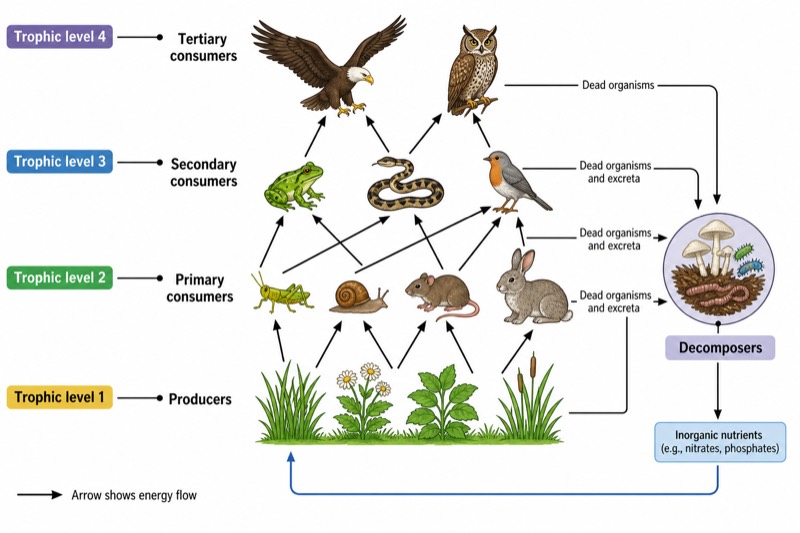
Labels included in this diagram
- Producers
- Primary consumers
- Secondary consumers
- Tertiary consumers
- Decomposers
- Trophic level 1
- Trophic level 2
- Trophic level 3
- Trophic level 4
- Arrow shows energy flow
✓ Accurate labels ✓ Edit text after generation ✓ PNG for papers, posters & slides
 OUTPUT · 16:9 · PNG
What this diagram shows
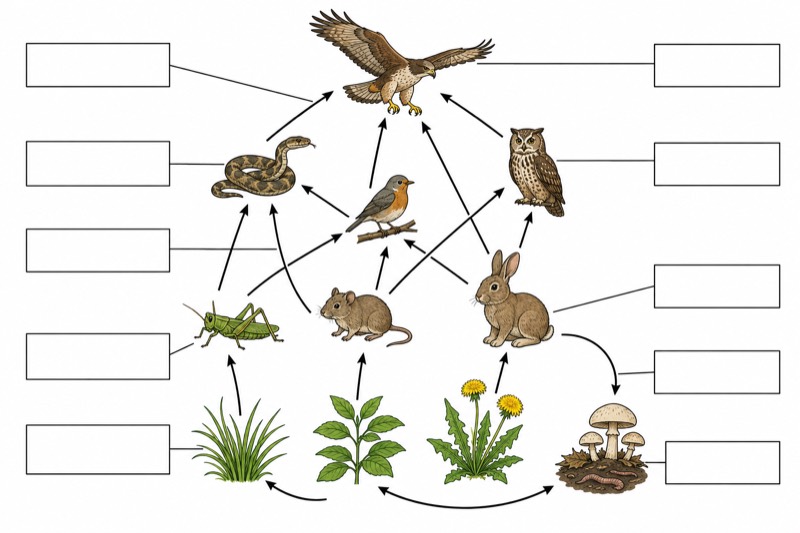
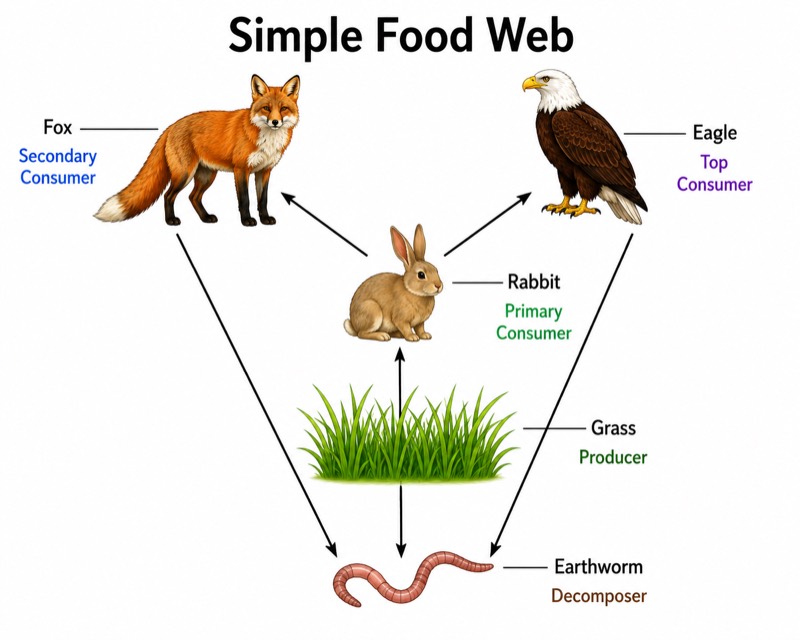
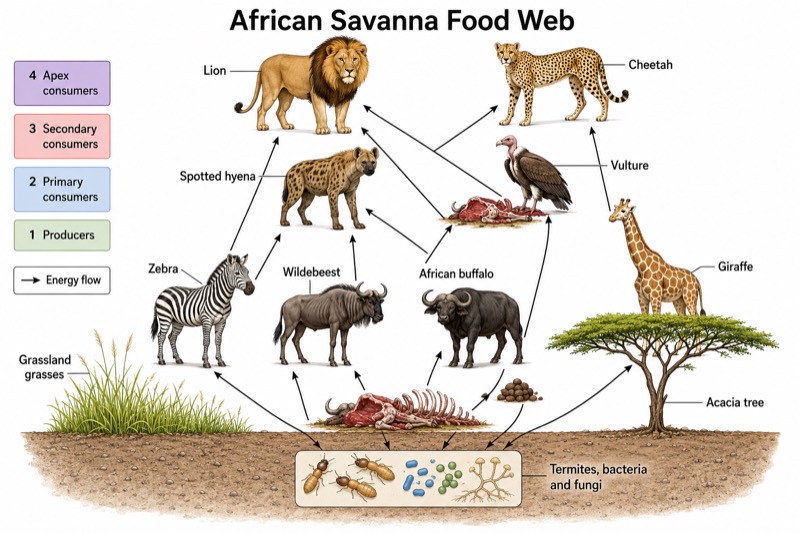
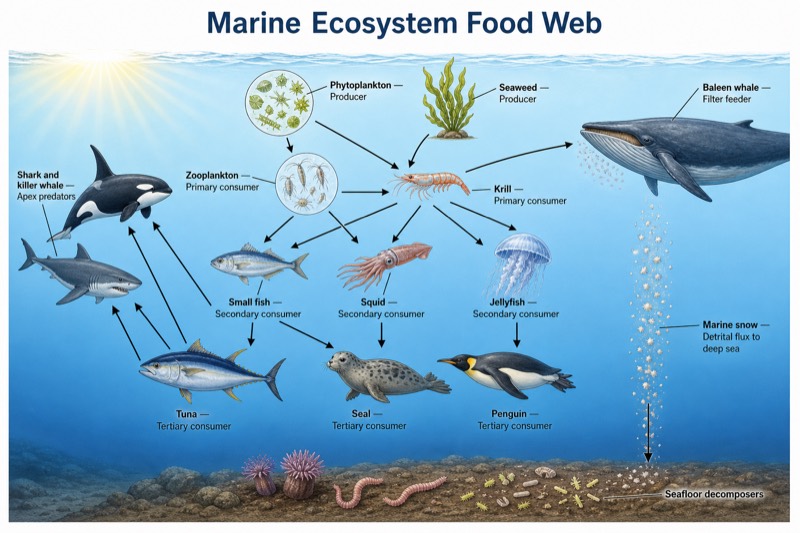
A food web shows the interconnected feeding relationships and energy pathways within an ecosystem. Green plants are producers because they convert light energy into chemical energy through photosynthesis. Herbivores that eat producers are primary consumers, while organisms that eat primary consumers are secondary consumers. Tertiary consumers feed at higher trophic levels and may function as top predators. Decomposers, including bacteria and fungi, obtain energy by breaking down dead organisms and organic waste. Unlike a single food chain, a food web contains several linked pathways, showing that most organisms have more than one food source or predator.
Arrows must point from the organism being eaten to the organism that eats it because they represent the direction of energy transfer, not the direction of attack. Energy enters through producers, then moves through primary, secondary, and tertiary consumers. At each trophic transfer, much energy is lost from the biological system as heat through respiration, while additional energy is used for movement, growth, and other life processes. Decomposers receive organic material from every trophic level and recycle mineral nutrients into the environment. Energy flows in one direction, whereas nutrients cycle between organisms and the physical environment.
What a correct diagram must include
- Energy source and producers: Show sunlight entering green plants, which form the first trophic level by producing organic matter through photosynthesis.
- Primary consumers: Include herbivores or plant-feeding omnivores at the second trophic level, with arrows leading from the plants they consume.
- Secondary consumers: Add organisms that eat primary consumers and place them at the third trophic level where appropriate.
- Tertiary consumers: Show higher-level predators receiving energy from secondary consumers; avoid assuming that every ecosystem has exactly four trophic levels.
- Correct arrow direction: Draw every feeding arrow from the food organism or prey toward the consumer or predator to indicate energy transfer.
- Interconnected feeding pathways: Give several organisms more than one connection so the diagram represents a food web rather than a single food chain.
- Decomposers and dead organic matter: Connect dead organisms and waste from all trophic levels to bacteria, fungi, or other decomposers.
- Trophic-level labels and energy loss: Label the trophic levels clearly and indicate that available energy decreases at each successive transfer.
Common mistakes
- Reversing arrows so they point from predator to prey; energy-flow arrows must point from the organism eaten to the organism that eats it.
- Drawing only one linear feeding sequence and calling it a food web; a true web must contain multiple interconnected food chains.
- Placing decomposers at only the highest trophic level; decomposers act on dead material and waste from organisms at every level.
- Showing energy as being recycled back to producers; nutrients are recycled, but energy flows one way and is gradually dissipated as heat.
- Assigning every species to one fixed trophic level; omnivores may occupy different trophic levels depending on what they eat.
Teaching tips
Use the diagram after introducing food chains and before teaching ecological pyramids. Ask students to identify producers, classify consumers, trace two possible energy pathways, and explain why each arrow points toward the consumer. Removing one species can support questions about direct and indirect effects across the web. The diagram also prepares students for assessment topics such as trophic levels, predator-prey relationships, energy-transfer efficiency, biomass loss, decomposer activity, and the distinction between one-way energy flow and nutrient cycling.
FAQ about this diagram
Why do food-web arrows point from prey to predator?
The arrows represent the transfer of chemical energy and matter. Energy stored in the prey's biomass moves to the predator when the prey is consumed.
Can one organism occupy more than one trophic level?
Yes. An omnivore may be a primary consumer when eating plants and a secondary or tertiary consumer when eating animals. Its trophic position depends on the pathway being examined.
Do decomposers recycle energy back to producers?
No. Decomposers release mineral nutrients that producers can reuse, but much of the chemical energy is released as heat during respiration. Therefore, nutrients cycle while energy flows in one direction.