Ocean Food Web Diagram
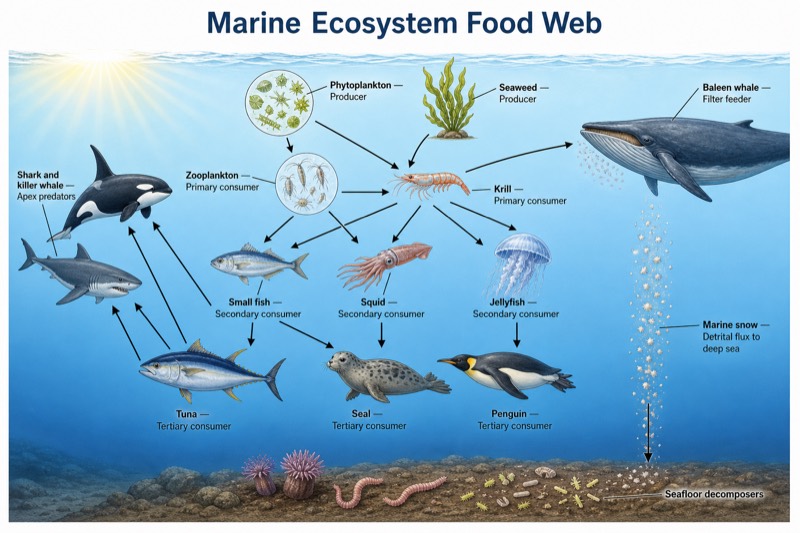
Ocean Food Web Diagram — an alternative version of the Food Web and Energy Flow, generated by AI and fully editable. Download the PNG for quizzes, homework or slides.
Labels included in this diagram
- Phytoplankton — Producer
- Seaweed — Producer
- Zooplankton — Primary consumer
- Krill — Primary consumer
- Small fish — Secondary consumer
- Squid — Secondary consumer
- Jellyfish — Secondary consumer
- Tuna — Tertiary consumer
- Seal — Tertiary consumer
- Penguin — Tertiary consumer
- Shark and killer whale — Apex predators
- Baleen whale — Filter feeder
- Marine snow — Detrital flux to deep sea
- Seafloor decomposers
✓ Accurate labels ✓ Edit text after generation ✓ PNG for papers, posters & slides
 OUTPUT · 16:9 · PNG
What this diagram shows
This ocean food web diagram presents energy flow through a marine ecosystem rather than the broad, simplified relationships shown in the standard main food-web graphic. Producers include phytoplankton and seaweed; zooplankton and krill are primary consumers; small fish, squid, and jellyfish are secondary consumers; and tuna, seals, and penguins occupy higher trophic levels. Sharks and orcas appear as apex predators. Baleen whales represent filter feeding, while seafloor decomposers complete the detrital pathway. A light-to-deep blue background also connects feeding relationships with ocean depth.
Read every arrow from the organism being eaten toward the consumer, because the arrow represents the transfer of food energy rather than the direction of attack. Begin with producers, trace several possible routes to top predators, and then compare those routes with the downward flow of marine snow to deep-sea decomposers. This specialized version is preferable to the standard diagram when a lesson must address pelagic and benthic links, filter feeding, depth zones, or marine detritus. It also helps students see why one species can belong to several overlapping food chains.
Teaching tips
- Classroom quiz: remove selected organism names or trophic-level labels and ask students to identify producers, consumers, apex predators, and decomposers. Require them to justify each answer by following the arrows in the ocean food web diagram.
- Homework: have students trace three energy pathways, such as phytoplankton to krill to penguin to orca, and explain how energy availability decreases at each transfer. Ask them to compare one grazing pathway with the marine-snow detrital pathway.
- Presentation slide: use the specialized marine version when teaching pelagic versus benthic processes. Reveal the diagram in stages, beginning with producers and adding consumers, apex predators, baleen whales, and deep-sea decomposers.
- Revision outline or printed handout: place the diagram beside a table of trophic levels so students can match each organism to its ecological role. The depth-colored background can also support notes on sunlit surface waters and deeper decomposition zones.
- Essay or research-paper illustration: use the figure to explain how changes in krill, small fish, or phytoplankton could affect several predators at once. Unlike a standard food-web overview, this version supports discussion of marine snow, filter feeders, and connections between surface production and the seafloor.
FAQ about this diagram
Why do the arrows point from prey to predator?
Food-web arrows show the direction in which matter and energy are transferred. An arrow from krill to a penguin therefore means that the penguin obtains energy by eating the krill, not that the penguin is being attacked.
Why use this marine variant instead of a standard food web diagram?
The standard main diagram is useful for introducing general feeding relationships, but it may not show ocean depth, filter feeding, marine snow, or seafloor decomposition. This ocean-specific version is better when students need to connect trophic levels with pelagic-benthic coupling and the movement of detritus into deep water.