Savanna Food Web Diagram
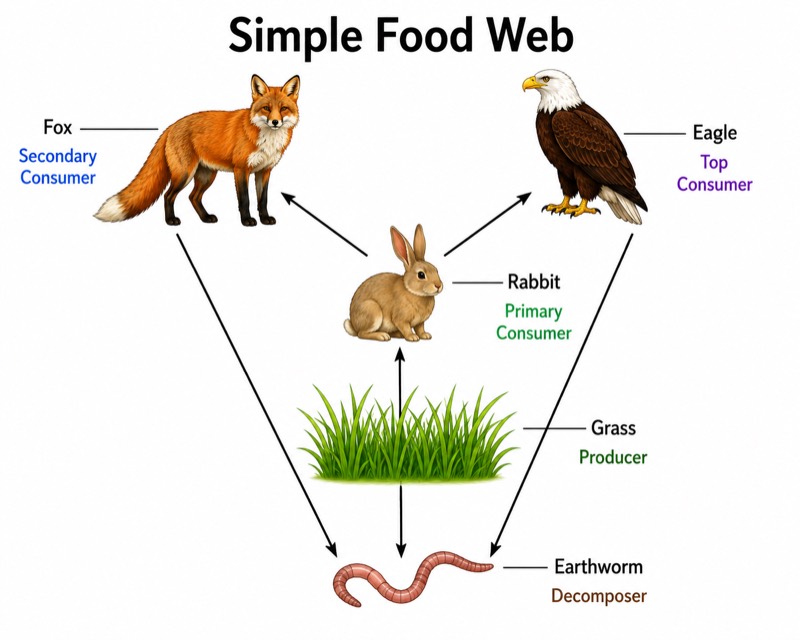
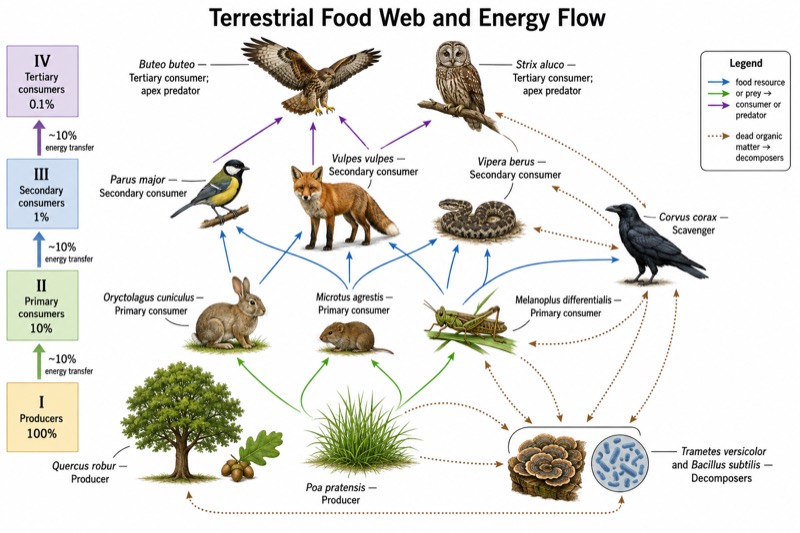
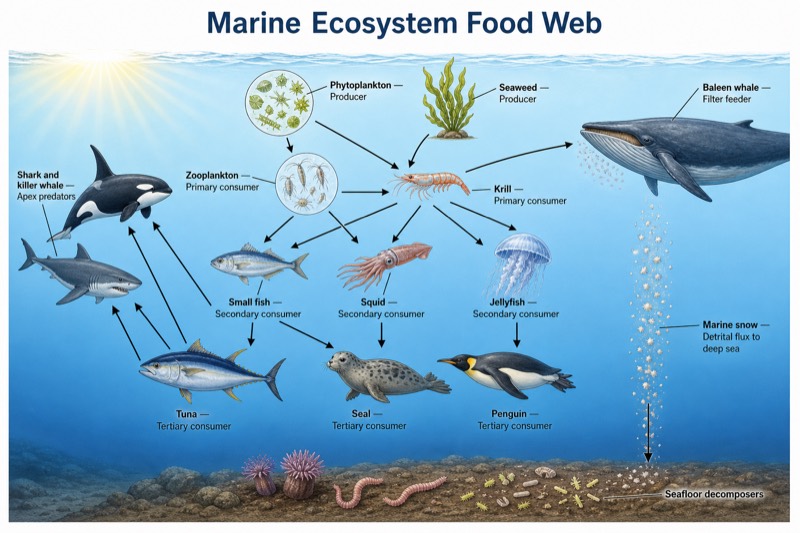
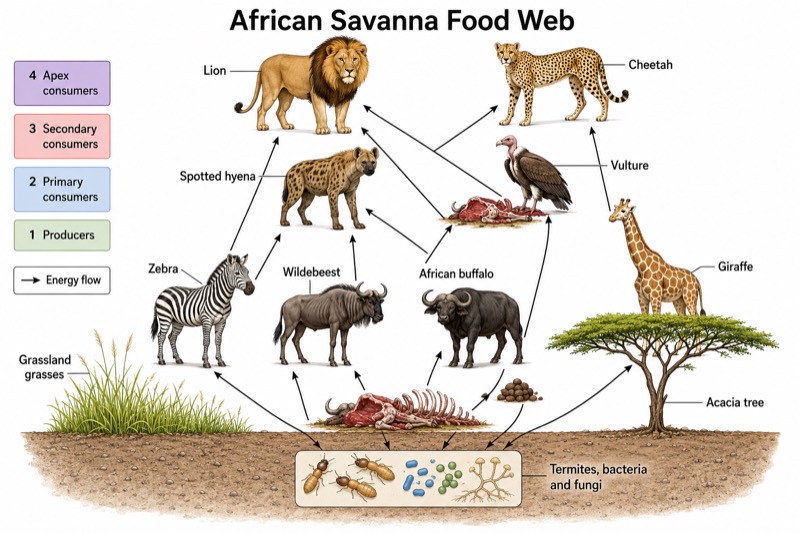
Savanna Food Web Diagram — an alternative version of the Food Web and Energy Flow, generated by AI and fully editable. Download the PNG for quizzes, homework or slides.
Labels included in this diagram
- Grassland grasses
- Acacia tree
- Zebra
- Wildebeest
- African buffalo
- Giraffe
- Lion
- Cheetah
- Spotted hyena
- Vulture
- Termites, bacteria and fungi
- Trophic levels: 1 Producers; 2 Primary consumers; 3 Secondary consumers; 4 Apex consumers
- Energy flow
✓ Accurate labels ✓ Edit text after generation ✓ PNG for papers, posters & slides
 OUTPUT · 16:9 · PNG
What this diagram shows
This savanna food web diagram presents an African grassland ecosystem with grasses and acacia trees; zebras, wildebeest, African buffalo, and giraffes; lions, cheetahs, and spotted hyenas; vultures; and termites, bacteria, and fungi. Unlike the standard main diagram, which summarizes food-web structure with general organism groups, this version uses named savanna species, a grassland setting, and ecosystem-specific feeding relationships. It is useful when students need to connect the abstract ideas of trophic levels, interdependence, scavenging, decomposition, and energy transfer to a recognizable real-world ecosystem.
Read each arrow from the organism being eaten toward the organism receiving its energy: for example, grass points to zebra, and zebra points to lion or spotted hyena. The four labeled trophic levels organize producers, primary consumers, secondary consumers, and tertiary or apex consumers, while vultures and decomposers show pathways that operate across several levels. Compared with the standard main graphic, this specialized version supports closer analysis of one ecosystem. Use it to trace energy-flow routes, identify organisms with multiple food sources, compare competing predators, or predict how a decline in one savanna population could affect the wider web.
Teaching tips
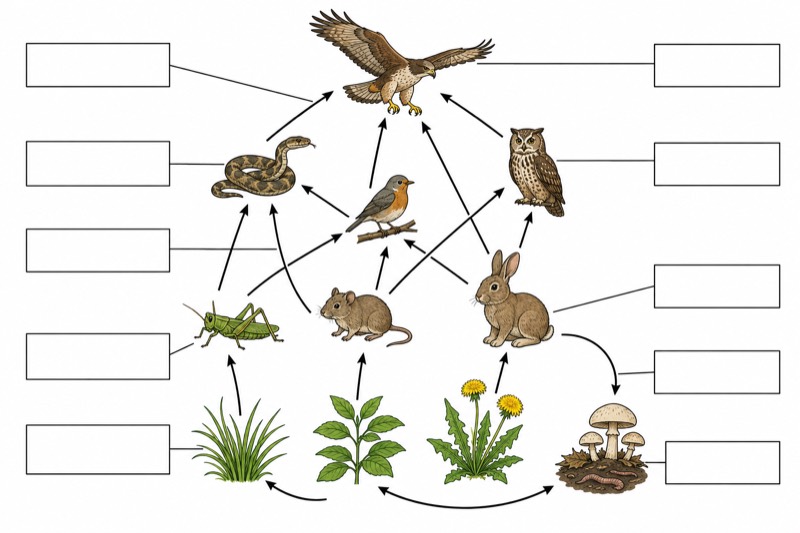
- In-class quiz: remove selected organism labels or arrowheads and ask students to identify producers, consumers, scavengers, decomposers, and the correct direction of energy flow.
- Homework: have students trace three different food chains within the larger web, name the trophic level of each organism, and explain why a food web is more realistic than a single chain.
- Presentation slides: display the diagram while modeling how energy from grasses or acacia trees can reach lions, cheetahs, spotted hyenas, vultures, and decomposers through different routes.
- Review outline or printed handout: place the specialized savanna diagram beside the standard main diagram so students can translate general trophic categories into named African grassland organisms.
- Essay or research-paper figure: use the diagram as a conceptual illustration of savanna interdependence, then discuss competition, carrion use, nutrient recycling, or the likely effects of herbivore population change.
FAQ about this diagram
Why do the arrows point from prey to predator rather than from predator to prey?
Food-web arrows represent the transfer of energy and matter, not the direction of attack. Therefore, an arrow points from grass to zebra and from zebra to lion because stored chemical energy moves toward the consumer.
How is this savanna version different from a standard food web diagram?
The standard main diagram emphasizes universal roles and simplified relationships, whereas this version uses named savanna organisms, an African grassland background, and specific predator–prey links. Use this version when teaching ecosystem application, population-change predictions, or the roles of vultures, termites, bacteria, and fungi in recycling matter.