Detailed Food Web Diagram (University Level)
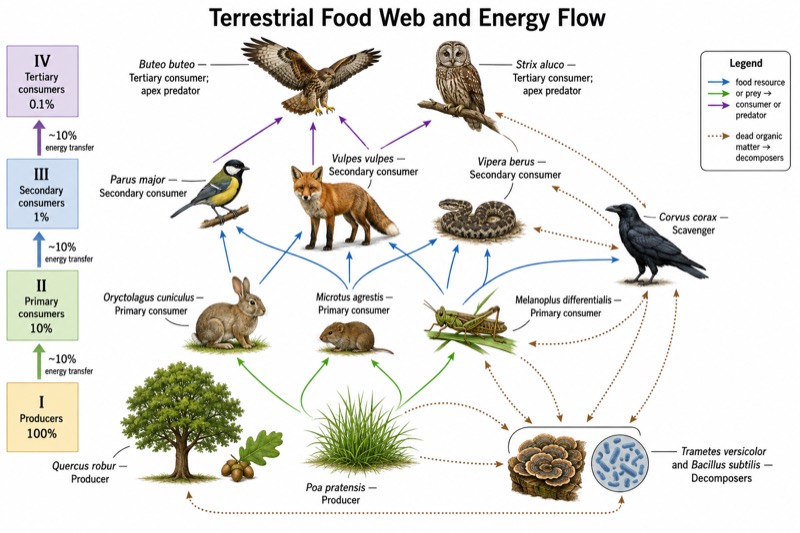
Detailed Food Web Diagram (University Level) — an alternative version of the Food Web and Energy Flow, generated by AI and fully editable. Download the PNG for quizzes, homework or slides.
Labels included in this diagram
- Quercus robur — Producer
- Poa pratensis — Producer
- Oryctolagus cuniculus — Primary consumer
- Microtus agrestis — Primary consumer
- Melanoplus differentialis — Primary consumer
- Parus major — Secondary consumer
- Vulpes vulpes — Secondary consumer
- Vipera berus — Secondary consumer
- Buteo buteo — Tertiary consumer; apex predator
- Strix aluco — Tertiary consumer; apex predator
- Corvus corax — Scavenger
- Trametes versicolor and Bacillus subtilis — Decomposers
- Trophic levels: I Producers 100%; II Primary consumers 10%; III Secondary consumers 1%; IV Tertiary consumers 0.1%
- Legend: food resource or prey -> consumer or predator; dead organic matter -> decomposers
✓ Accurate labels ✓ Edit text after generation ✓ PNG for papers, posters & slides
 OUTPUT · 16:9 · PNG
What this diagram shows
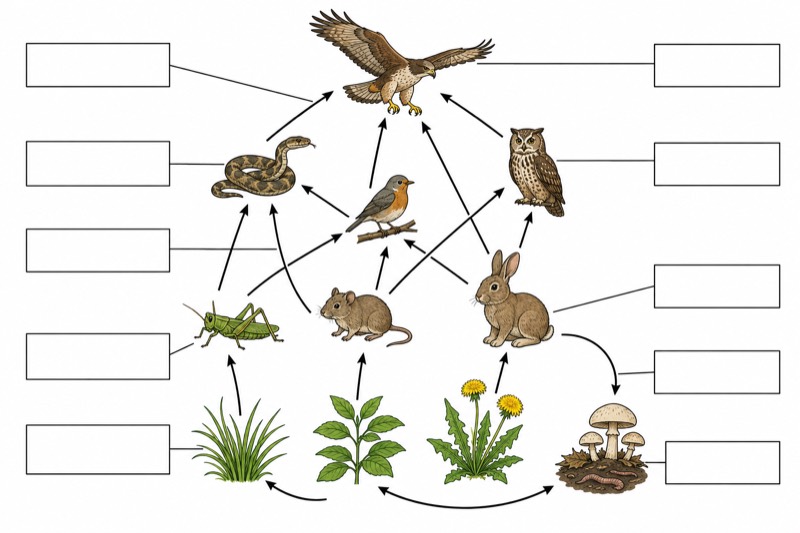
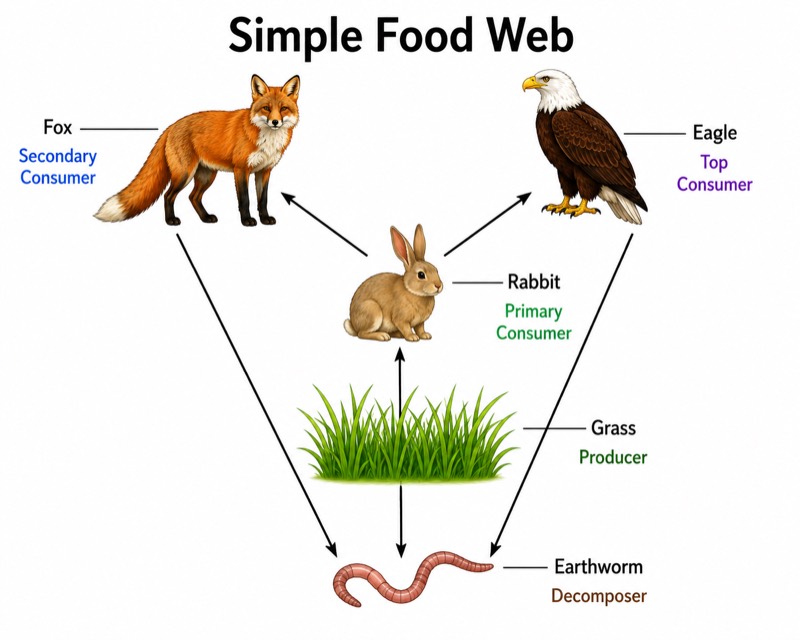
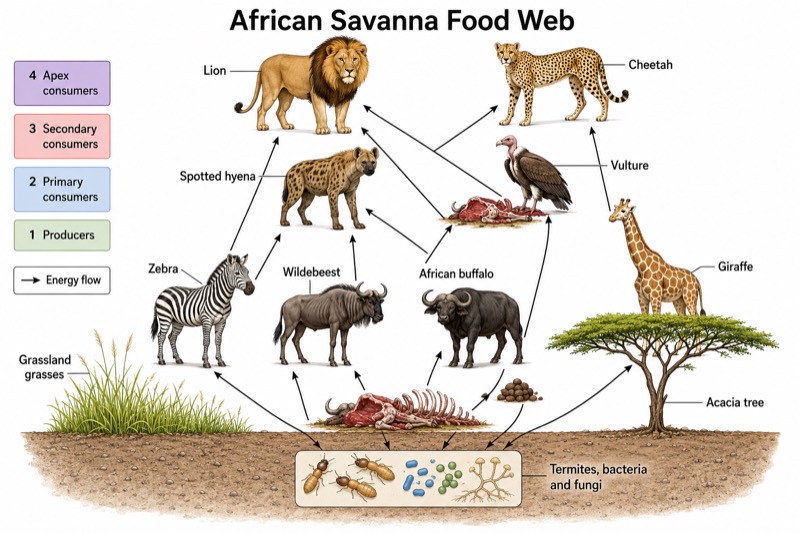
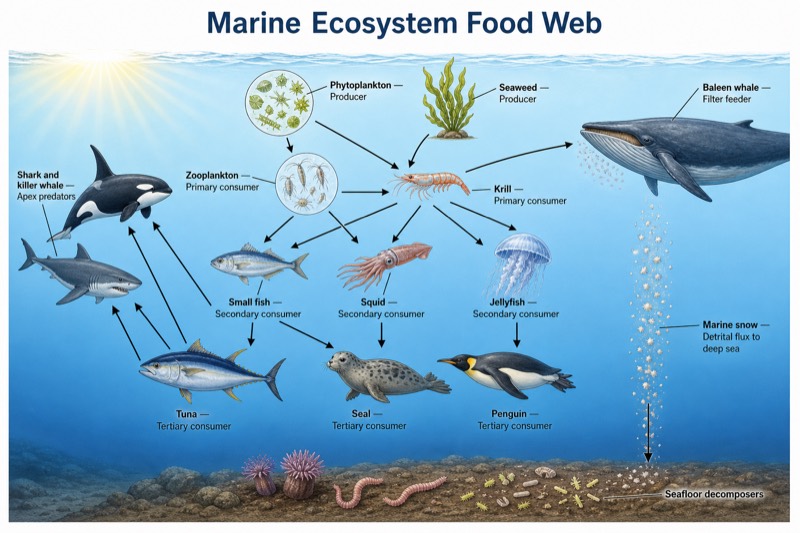
This detailed food web diagram (university level) maps a terrestrial ecosystem containing more than 12 organisms, identified with accepted scientific names. Unlike the standard overview, it separates producers, primary, secondary, and tertiary consumers, apex predators, scavengers, and decomposers. Four trophic levels are marked, and the approximate 10% transfer of energy between levels is shown. This version is needed when a simple linear food chain cannot represent omnivory, multiple prey links, detrital pathways, or the ecological consequences of changing one population.
Read each arrow from the organism being consumed toward the consumer, because the arrow represents the direction of energy transfer rather than the direction of attack. Begin with green plants at trophic level one, trace alternative pathways through consumers, and then follow dead organic matter toward scavengers and decomposers. The noncrossing leader lines and category legend make this research-level version suitable for analyzing network structure. Use it instead of the standard main diagram when students must compare trophic roles, estimate energy loss, or predict indirect population effects.
Teaching tips
- In-class quiz: remove selected species names, trophic-level labels, or arrowheads and ask students to restore them, justify arrow direction, and distinguish primary consumers from omnivorous secondary consumers.
- Homework: assign one producer-to-apex-predator pathway and have students calculate the energy remaining at each trophic level using the approximate 10% transfer rule, while noting that real transfer efficiency varies.
- Lecture slides: reveal the web by trophic level, then contrast this detailed version with the standard main diagram to demonstrate why interconnected feeding relationships provide better predictions than a single food chain.
- Revision outline or printed handout: ask students to color-code producers, consumers, scavengers, and decomposers, then annotate examples of competition, omnivory, detritivory, and indirect effects.
- Research report or paper figure: use the diagram as a conceptual ecosystem model, define every arrow in the caption, retain scientific names, and distinguish documented feeding interactions from simplified teaching assumptions.
FAQ about this diagram
Why use this university-level version instead of the standard food web diagram?
The standard diagram is designed to introduce basic feeding relationships, whereas this version distinguishes more than 12 taxa, four trophic levels, apex predators, scavengers, decomposers, and detrital links. Use the detailed version when the task requires network analysis, energy-transfer calculations, or discussion of indirect ecological effects.
Do the arrows show which organism attacks another?
No. Each arrow points from the food organism or energy source to the consumer, showing the direction in which chemical energy and biomass move through the ecosystem. Decomposer links should likewise originate from dead organic matter or the organisms contributing to detritus and point toward decomposers.