Photosynthesis Process Diagram Generator
Free online Photosynthesis Process Diagram generator: get a fully labeled figure in about 90 seconds. The AI plans the must-have label list first, then renders a clean textbook-style diagram — every label editable afterwards, ready for papers, assignments and slides.
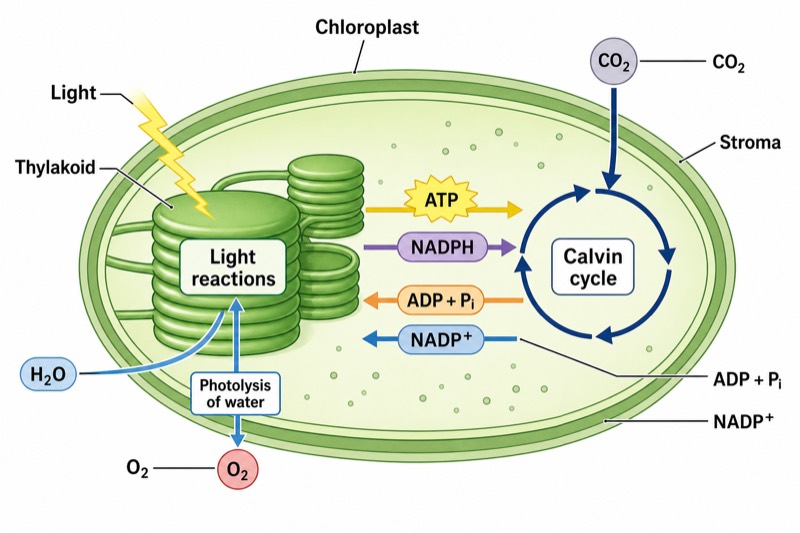
Labels included in this diagram
- Chloroplast
- Thylakoid
- Stroma
- Light
- Light reactions
- Photolysis of water
- H₂O
- O₂
- ATP
- NADPH
- CO₂
- Calvin cycle
- ADP + Pi
- NADP⁺
✓ Accurate labels ✓ Edit text after generation ✓ PNG for papers, posters & slides
 OUTPUT · 16:9 · PNG
What this diagram shows
A Photosynthesis Process Diagram shows how a chloroplast converts light energy into chemical energy and uses that energy to synthesize organic molecules. The light reactions occur in the thylakoid membranes, where chlorophyll absorbs light and water undergoes photolysis. This process releases O₂ and supports the production of ATP and NADPH. The Calvin cycle occurs in the stroma, where CO₂ is fixed and reduced using ATP and NADPH. The diagram should therefore distinguish the chloroplast’s internal structures while tracing the movement of matter, energy, and electron carriers between the two stages.
The two stages are linked by ATP, NADPH, ADP + Pi, and NADP⁺. During the light reactions, light-driven electron transport and chemiosmosis produce ATP, while NADP⁺ accepts high-energy electrons and H⁺ to form NADPH. Photolysis of H₂O supplies electrons and releases O₂ as a by-product. ATP and NADPH then enter the Calvin cycle in the stroma, providing energy and reducing power for CO₂ fixation and carbohydrate synthesis. After use, ADP + Pi and NADP⁺ return to the light reactions, forming a continuous exchange between the thylakoid membranes and the stroma.
A Photosynthesis Process Diagram shows how a chloroplast converts light energy into chemical energy and uses that energy to synthesize organic molecules. The light reactions occur in the thylakoid membranes, where chlorophyll absorbs light and water undergoes photolysis. This process releases O₂ and supports the production of ATP and NADPH. The Calvin cycle occurs in the stroma, where CO₂ is fixed and reduced using ATP and NADPH. The diagram should therefore distinguish the chloroplast’s internal structures while tracing the movement of matter, energy, and electron carriers between the two stages.
The two stages are linked by ATP, NADPH, ADP + Pi, and NADP⁺. During the light reactions, light-driven electron transport and chemiosmosis produce ATP, while NADP⁺ accepts high-energy electrons and H⁺ to form NADPH. Photolysis of H₂O supplies electrons and releases O₂ as a by-product. ATP and NADPH then enter the Calvin cycle in the stroma, providing energy and reducing power for CO₂ fixation and carbohydrate synthesis. After use, ADP + Pi and NADP⁺ return to the light reactions, forming a continuous exchange between the thylakoid membranes and the stroma.
What a correct diagram must include
- Chloroplast structure: Draw the chloroplast boundary and clearly separate the thylakoids from the surrounding stroma.
- Thylakoid and light reactions: Place the light reactions on the thylakoid membrane because photosystems, electron carriers, and ATP synthase are membrane-associated.
- Light input: Draw an arrow labeled Light pointing toward the thylakoid membrane to show the initial energy source.
- Photolysis of water: Show H₂O entering the light reactions and O₂ leaving; water provides electrons and H⁺, while oxygen is released as a by-product.
- ATP and NADPH production: Draw arrows from the light reactions to the Calvin cycle to represent the transfer of energy and reducing power.
- Calvin cycle location and input: Place the Calvin cycle in the stroma and show CO₂ entering it as the carbon source.
- Carrier recycling: Show ADP + Pi and NADP⁺ returning from the Calvin cycle to the light reactions so the relationship between the stages is complete.
- Arrow direction and labels: Use directional arrows consistently to distinguish inputs, outputs, energy transfer, and recycled molecules.
Common mistakes
- Placing the Calvin cycle inside the thylakoid: It occurs in the stroma, whereas the light reactions are associated with the thylakoid membrane.
- Showing O₂ as coming from CO₂: The oxygen released during photosynthesis comes from the photolysis of H₂O.
- Reversing ATP and NADPH flow: ATP and NADPH move from the light reactions to the Calvin cycle; ADP + Pi and NADP⁺ return in the opposite direction.
- Drawing the Calvin cycle as directly light-dependent: It does not absorb light directly, although it depends on ATP and NADPH produced by the light reactions.
- Treating ATP as the final product of photosynthesis: ATP is an intermediate energy carrier used within the chloroplast, not the main stored product exported by the process.
Teaching tips
Use the diagram after students have learned chloroplast structure and before they study detailed electron transport or individual Calvin cycle reactions. Ask students to identify where each stage occurs, trace the source of released O₂, and explain why ATP and NADPH arrows point toward the Calvin cycle. A useful exam-style task is to remove selected labels and require students to complete the inputs, outputs, and carrier-recycling arrows. The diagram also supports questions about structure–function relationships, energy conversion, carbon fixation, and the dependence of the Calvin cycle on the light reactions.
FAQ about this diagram
Why do the light reactions occur in the thylakoid membrane?
The thylakoid membrane contains chlorophyll, photosystems, electron carriers, and ATP synthase. Its organization also allows an H⁺ gradient to form across the membrane, driving ATP production by chemiosmosis.
Does the Calvin cycle occur only in darkness?
No. The Calvin cycle is light-independent because it does not use light directly, but it normally operates when ATP and NADPH from the light reactions are available. Calling it the dark reaction does not mean that darkness is required.
How are the light reactions and the Calvin cycle connected?
The light reactions supply ATP and NADPH to the Calvin cycle. After these molecules are used, ADP + Pi and NADP⁺ return to the thylakoid-associated reactions for regeneration.