Phylogenetic Tree Generator
Free online Phylogenetic Tree generator: get a fully labeled figure in about 90 seconds. The AI plans the must-have label list first, then renders a clean textbook-style diagram — every label editable afterwards, ready for papers, assignments and slides.
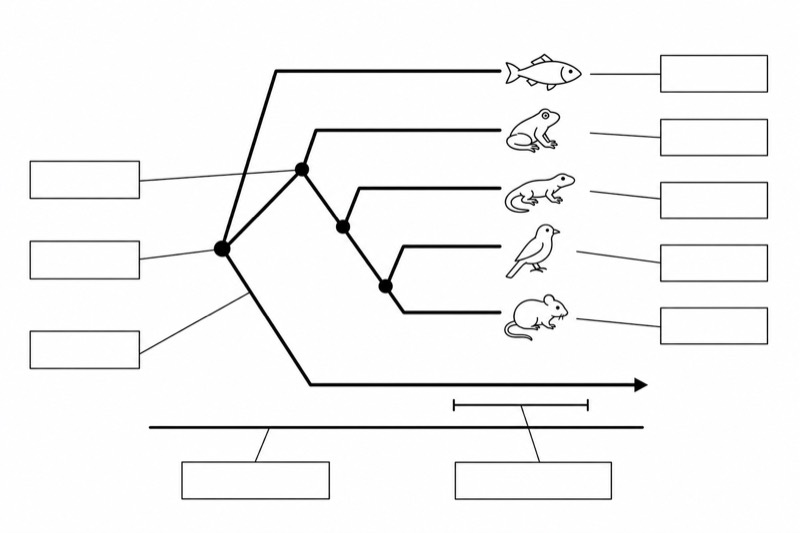
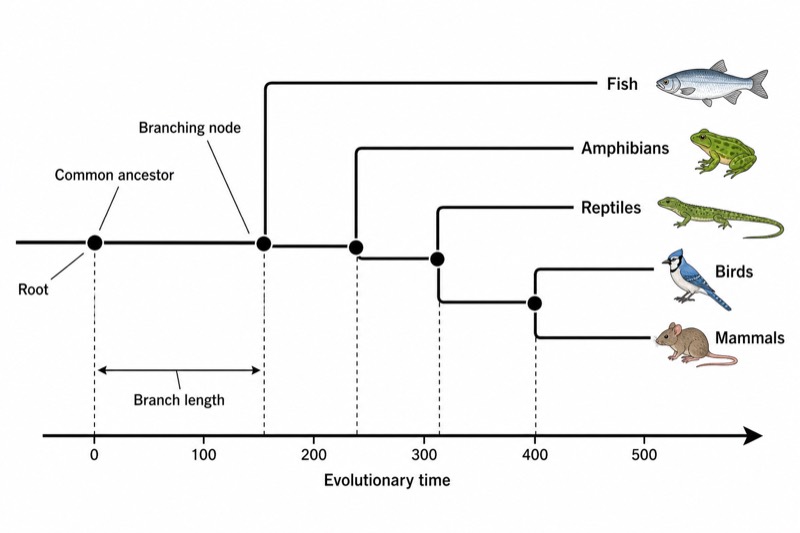
Labels included in this diagram
- Common ancestor
- Branching node
- Fish
- Amphibians
- Reptiles
- Birds
- Mammals
- Evolutionary time
- Branch length
- Root
✓ Accurate labels ✓ Edit text after generation ✓ PNG for papers, posters & slides
 OUTPUT · 16:9 · PNG
What this diagram shows
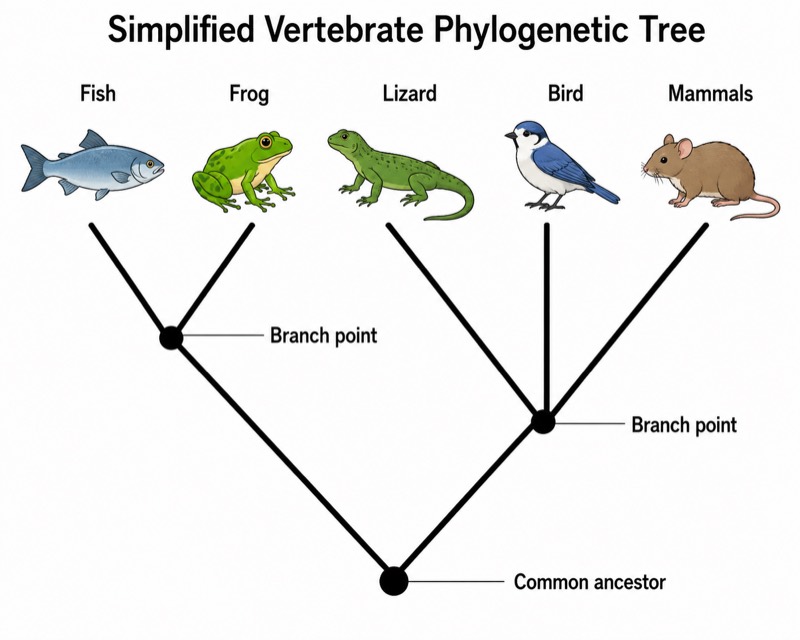
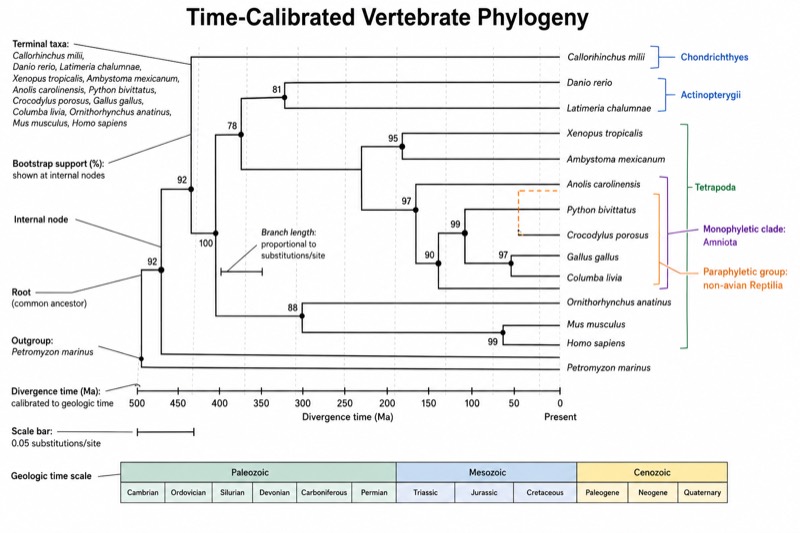
This phylogenetic tree is a branching hypothesis about evolutionary relationships among major vertebrate groups. The root represents the inferred common ancestor of all taxa shown, while each branch traces a lineage through evolutionary history. Internal nodes represent inferred common ancestors and divergence events; terminal branches lead to labeled groups such as fish, amphibians, reptiles, birds, and mammals. The diagram should not be read as a ladder of progress. In modern systematics, “fish” is often a convenient informal grouping rather than a single clade, because tetrapods arose within lobe-finned fishes. Birds are also nested within the reptilian lineage.
The branching pattern expresses relative relatedness: taxa sharing a more recent node have a more recent common ancestor. Reading from the root toward the tips follows evolutionary time when the tree is time-scaled, so the horizontal or vertical axis indicates when lineages diverged. Branch length may represent elapsed time, inferred evolutionary change, or simply drawing space; its meaning must be stated. Rotating branches around a node does not change relationships, but moving a lineage across a node does. The tree therefore distinguishes topology, divergence order, and, when calibrated, approximate evolutionary timing.
What a correct diagram must include
- Root — place it at the ancestral end of the diagram and identify the direction of evolutionary time.
- Terminal taxa — label every endpoint clearly, using comparable taxonomic ranks and avoiding ambiguous common names when precision is required.
- Internal nodes — mark each branching point as an inferred common ancestor and divergence event, not as a fully known fossil individual.
- Branches — connect nodes and taxa continuously; each branch represents a lineage, not a measure of biological superiority.
- Clade structure — show groups as monophyletic clades when making formal taxonomic claims, including birds within the reptile clade.
- Time axis — include a calibrated scale only when branch positions or lengths represent geological time.
- Branch-length legend — state whether length represents time, evolutionary change, or no quantitative variable.
- Outgroup or rooting method — identify the outgroup or evidence used to root the tree, because rooting determines the direction of inferred ancestry.
Common mistakes
- Reading the tree from left to right as a ladder of progress, with mammals treated as the goal of evolution rather than one surviving lineage.
- Assuming the closest-looking tips are most closely related; relatedness is determined by the most recent shared node, not by visual distance.
- Treating every node as a known ancestral species; most nodes represent inferred common ancestors reconstructed from comparative evidence.
- Assuming all branch lengths show time or evolutionary change when the diagram is an unscaled cladogram.
- Grouping birds outside reptiles or treating “fish” as a complete clade without recognizing that tetrapods evolved within the lobe-finned fish lineage.
Teaching tips
Use the figure during an introductory lecture, a tree-reading workshop, or an assessment of comparative evolution. Ask students to identify the root, a sister-group relationship, a most recent common ancestor, and the order of divergence. Then rotate selected branches and ask whether the relationships changed. Connect the activity to synapomorphies, monophyletic groups, molecular or morphological evidence, and the distinction between a cladogram and a time-calibrated phylogeny. Finish by asking students to redraw the tree from a written set of relationships.
FAQ about this diagram
What does an internal node represent?
An internal node represents an inferred common ancestor and the divergence of descendant lineages. It usually does not correspond to a directly observed individual organism or a precisely identified fossil species.
Does a longer branch mean that a group is more evolved?
No. Evolution does not have a universal scale from primitive to advanced. A branch length has quantitative meaning only when the figure states that it represents time, genetic change, or another measured variable.
Why are birds often shown within reptiles?
Birds evolved from theropod dinosaurs, so they are nested within the broader reptile clade under a phylogenetic definition. Excluding birds would make “reptiles” paraphyletic rather than monophyletic.