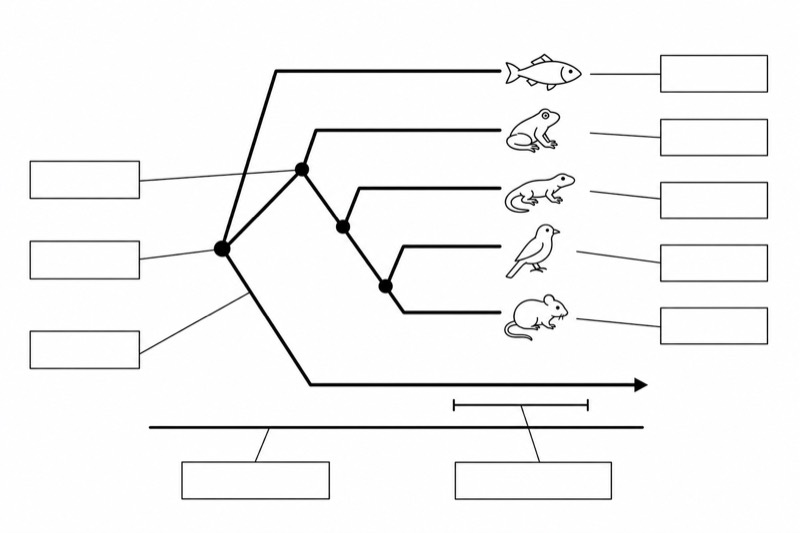
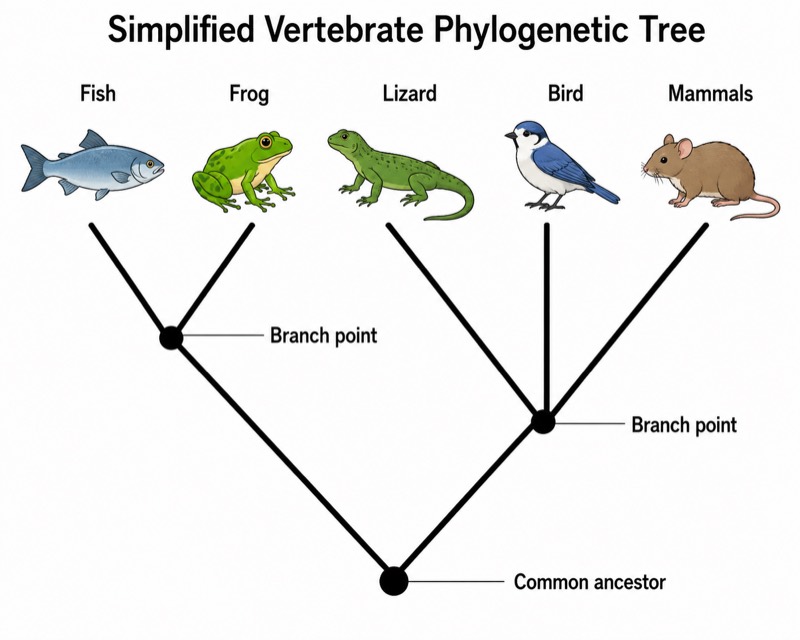
Detailed Phylogenetic Tree (University Level)
Detailed Phylogenetic Tree (University Level) — an alternative version of the Phylogenetic Tree, generated by AI and fully editable. Download the PNG for quizzes, homework or slides.
Labels included in this diagram
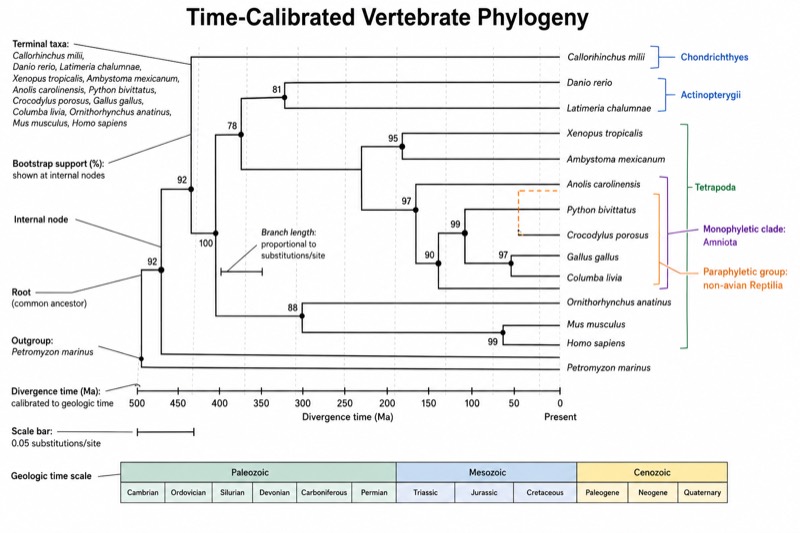
- Root (common ancestor)
- Outgroup: Petromyzon marinus
- Terminal taxa: Callorhinchus milii, Danio rerio, Latimeria chalumnae, Xenopus tropicalis, Ambystoma mexicanum, Anolis carolinensis, Python bivittatus, Crocodylus porosus, Gallus gallus, Columba livia, Ornithorhynchus anatinus, Mus musculus, Homo sapiens
- Internal node
- Branch length
- Scale bar: 0.05 substitutions/site
- Bootstrap support (%)
- Divergence time (Ma)
- Geologic time scale
- Chondrichthyes
- Actinopterygii
- Tetrapoda
- Monophyletic clade: Amniota
- Paraphyletic group: non-avian Reptilia
✓ Accurate labels ✓ Edit text after generation ✓ PNG for papers, posters & slides
 OUTPUT · 16:9 · PNG
What this diagram shows
This detailed phylogenetic tree (university level) expands the standard overview of fishes, amphibians, reptiles, birds, and mammals into a research-style vertebrate phylogeny with more than 12 terminal taxa. It identifies the root, outgroup, internal nodes, common ancestors, sister taxa, terminal branches, monophyletic clades, a paraphyletic grouping, bootstrap support values, divergence dates, branch lengths, and a substitutions-per-site scale bar. Unlike the standard main diagram, which emphasizes only broad evolutionary relationships, this version distinguishes topology, statistical support, molecular change, and geological time. Use it when learners must interpret evidence rather than simply recognize major vertebrate groups.
Read from the root toward the terminal taxa, using each bifurcating internal node as a hypothesis of shared ancestry. Compare branching order to identify sister groups and clades, then inspect bootstrap values to judge node support. Branch length should be interpreted with the labeled scale: molecular distance in substitutions per site is not automatically equivalent to elapsed time. The geological time axis and dated nodes provide a separate estimate of divergence timing. This version differs from the standard tree because it supports quantitative comparison, clade evaluation, and discussion of uncertainty; it is therefore preferable for university exercises, research methods lessons, and scientifically rigorous figures.
Teaching tips
- In-class quiz: remove selected labels and ask students to identify the root, outgroup, sister taxa, internal nodes, monophyletic groups, and the paraphyletic grouping from the topology.
- Homework assignment: have students compare bootstrap values, calculate approximate molecular distances from the scale bar, and explain why branch length and divergence time may not be interchangeable.
- Lecture slide: reveal the tree in stages, beginning with the standard five-group vertebrate overview and then adding terminal taxa, support values, branch lengths, and dated nodes to show why the detailed version is needed.
- Revision outline or printed handout: use the figure as an annotated reference for topology, common ancestry, clade terminology, substitutions per site, geological periods, and divergence-time interpretation.
- Paper or laboratory report figure: present a publication-style phylogeny with scientific taxon names, an explicit outgroup, node-support values, a molecular-distance scale, and a time axis; define the inference method and data source in the caption.
FAQ about this diagram
Why use this detailed version instead of the standard vertebrate phylogenetic tree?
The standard main diagram is best for introducing broad relationships among major vertebrate groups. This version is needed when students must evaluate node support, branch-length meaning, divergence estimates, outgroup rooting, and the distinction between monophyletic and paraphyletic groups.
Do longer branches always mean that a lineage is older?
No. In a phylogram, branch length usually represents estimated molecular change, such as substitutions per site, whereas a chronogram scales branches to time. Read the scale bar and geological axis separately unless the figure explicitly states that branch lengths are time-calibrated.