Genetic Pedigree Chart Generator
Free online Genetic Pedigree Chart generator: get a fully labeled figure in about 90 seconds. The AI plans the must-have label list first, then renders a clean textbook-style diagram — every label editable afterwards, ready for papers, assignments and slides.
Labels included in this diagram
- Normal male
- Normal female
- Affected individual
- Carrier
- Generation I
- Generation II
- Generation III
- Legend
✓ Accurate labels ✓ Edit text after generation ✓ PNG for papers, posters & slides
 OUTPUT · 16:9 · PNG
What this diagram shows
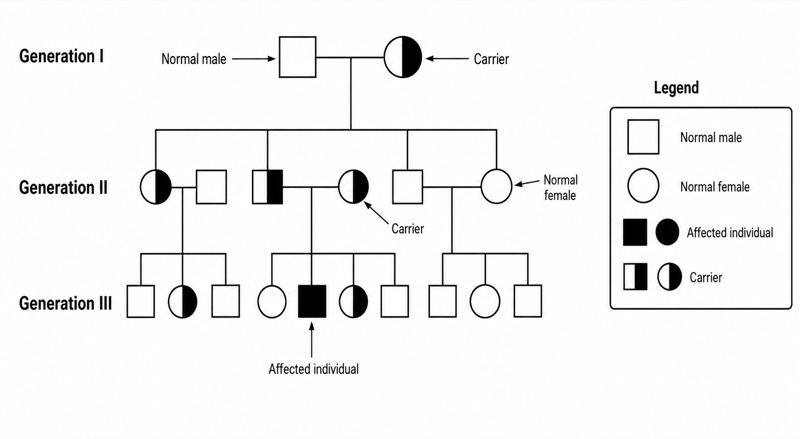
A genetic pedigree chart shows how a trait or genetic disorder is transmitted through a family. In this three-generation chart, squares represent males and circles represent females. Unshaded symbols indicate normal individuals, fully shaded symbols indicate affected individuals, and half-shaded symbols indicate carriers. For an autosomal recessive disorder, affected individuals have two recessive alleles, while carriers are phenotypically normal but possess one recessive allele. Generation I, Generation II, and Generation III identify successive generations and allow inheritance patterns to be traced over time. The Legend defines every symbol used in the chart.
Individuals in the same generation are arranged on one horizontal level. A horizontal line between a male and a female indicates a mating pair, while a vertical descent line leads to their children, who are joined by a sibship line. In autosomal recessive inheritance, two normal carriers may produce an affected child because each parent can pass on the recessive allele. For a carrier-by-carrier cross, each child has a 25% probability of being affected, a 50% probability of being a carrier, and a 25% probability of inheriting no recessive allele. Males and females are affected with approximately equal frequency.
What a correct diagram must include
- Standard sex symbols: draw males as squares and females as circles so biological sex can be identified immediately.
- Phenotype shading: use unshaded symbols for normal individuals and fully shaded symbols for affected individuals.
- Carrier notation: use half-shaded symbols for known carriers of the autosomal recessive allele and explain this notation in the Legend.
- Three generation levels: label the rows Generation I, Generation II, and Generation III in chronological order from top to bottom.
- Family relationship lines: connect a mating pair with a horizontal line and place their children below a vertical descent line and sibship line.
- Individual order: arrange siblings from left to right, usually from oldest to youngest, and keep all members of one generation aligned.
- Clear Legend: include Normal male, Normal female, Affected individual, and Carrier so every symbol and shading pattern is unambiguous.
- Consistent inheritance logic: ensure affected individuals can receive one recessive allele from each parent and that carriers remain phenotypically normal.
Common mistakes
- Using circles and squares inconsistently, which makes the sexes of family members impossible to interpret correctly.
- Treating a carrier as affected; a heterozygous carrier of an autosomal recessive disorder is usually phenotypically normal.
- Connecting each child directly to one parent instead of using a descent line and a shared sibship line.
- Assuming that every normal individual is homozygous dominant; some normal individuals may be carriers.
- Applying the 1:2:1 genotype ratio to a small real family as an exact outcome rather than a probability for each independent birth.
Teaching tips
Use the chart after introducing dominant and recessive alleles and before solving pedigree-analysis problems. Ask students to identify sex, phenotype, generation, and family relationships first, then assign possible genotypes such as AA, Aa, and aa. Questions can progress from “Which individuals are affected?” to “Which normal individuals must be carriers?” and “What is the probability that the next child will be affected?” This activity directly supports assessment of autosomal inheritance, genotype inference, probability calculations, and the distinction between phenotype and genotype.
FAQ about this diagram
How can an affected child have two normal parents?
In autosomal recessive inheritance, both normal parents may be heterozygous carriers. If the child inherits the recessive allele from each parent, the child has genotype aa and expresses the disorder.
Does half-shading always mean that the individual is a carrier?
In this chart, half-shading represents a known carrier, but symbol conventions should always be checked in the Legend. A suspected carrier may instead be marked with a dot or another notation in some pedigrees.
How is autosomal recessive inheritance recognized in a pedigree?
The trait may skip generations, and affected children can be born to two normal parents. Males and females are usually affected at similar frequencies because the gene is located on an autosome.