PRISMA Flow Diagram for Systematic Reviews Generator
Free online PRISMA Flow Diagram for Systematic Reviews generator: get a fully labeled figure in about 90 seconds. The AI plans the must-have label list first, then renders a clean textbook-style diagram — every label editable afterwards, ready for papers, assignments and slides.
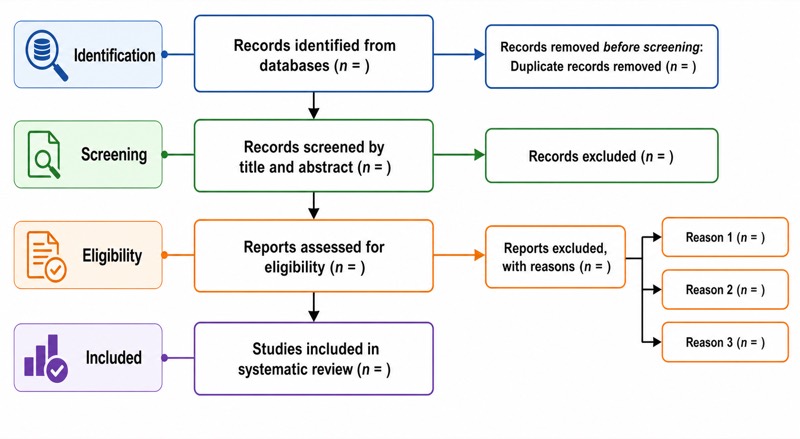
Labels included in this diagram
- Identification
- Records identified from databases (n = )
- Records removed before screening: Duplicate records removed (n = )
- Screening
- Records screened by title and abstract (n = )
- Records excluded (n = )
- Eligibility
- Reports assessed for eligibility (n = )
- Reports excluded, with reasons (n = )
- Reason 1 (n = )
- Reason 2 (n = )
- Reason 3 (n = )
- Included
- Studies included in systematic review (n = )
✓ Accurate labels ✓ Edit text after generation ✓ PNG for papers, posters & slides
 OUTPUT · 16:9 · PNG
What this diagram shows
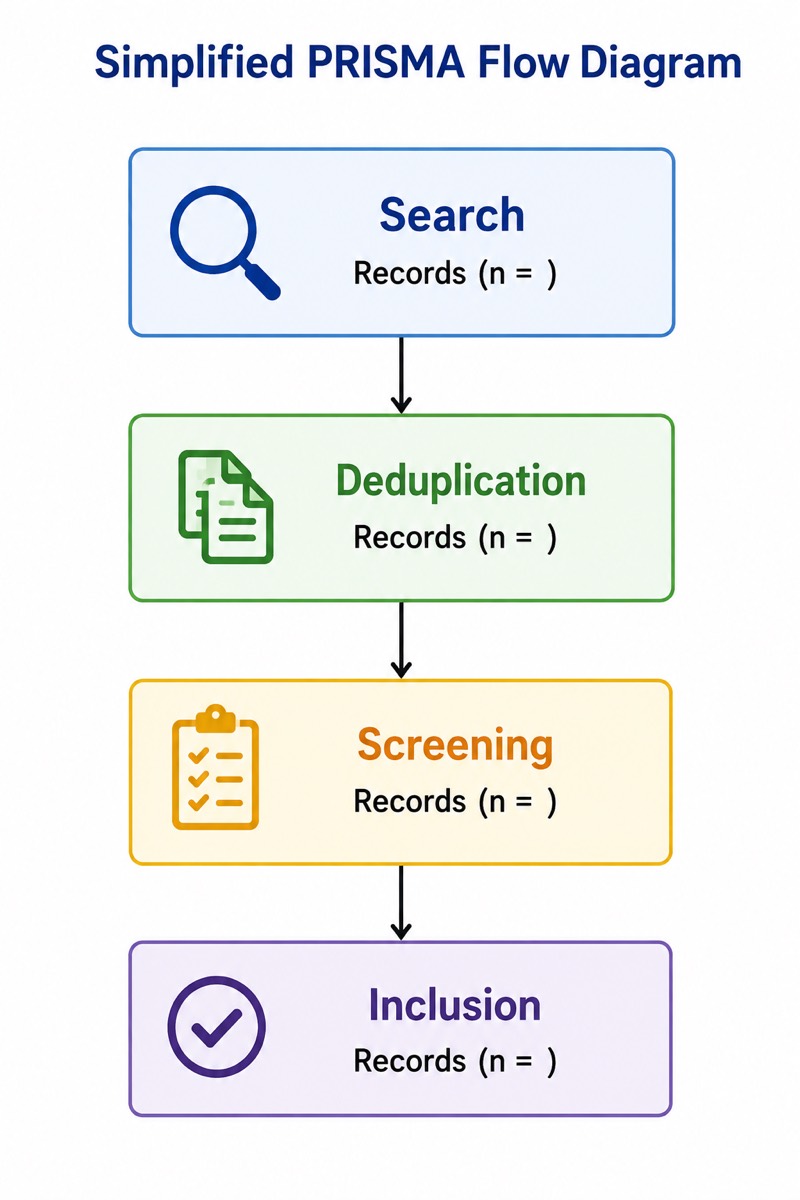
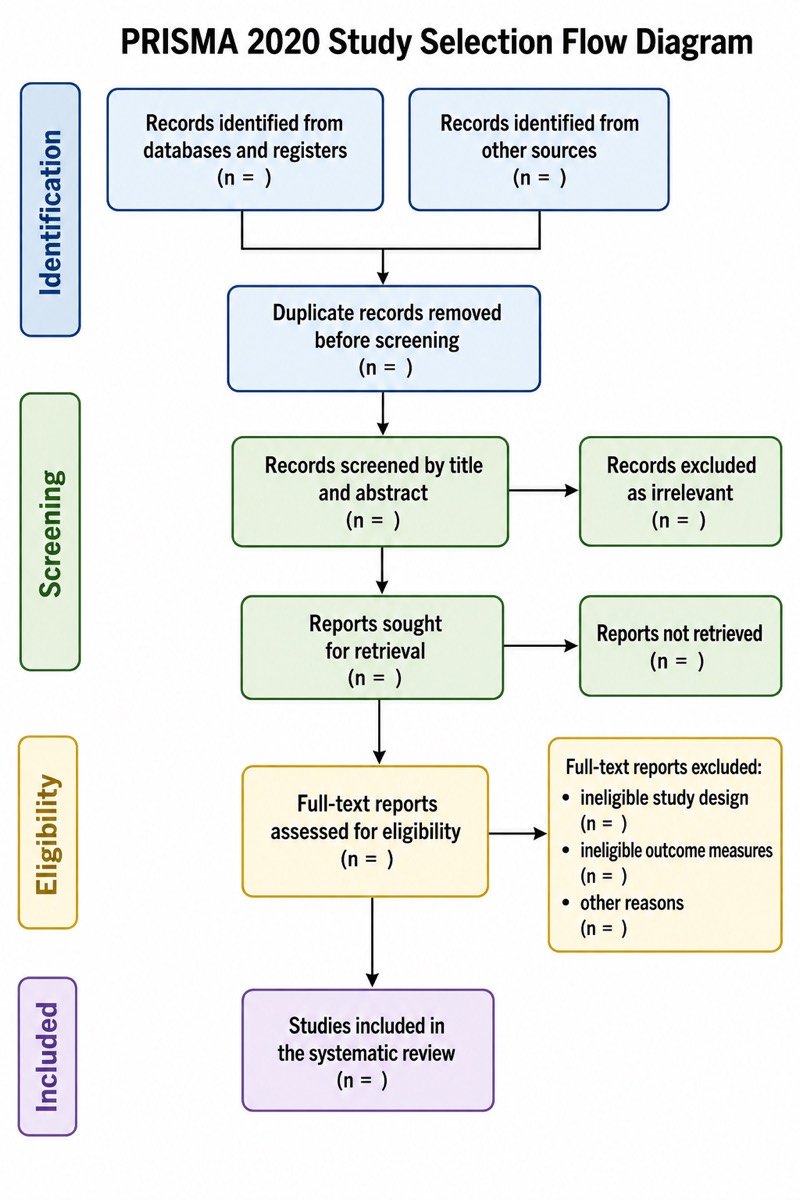
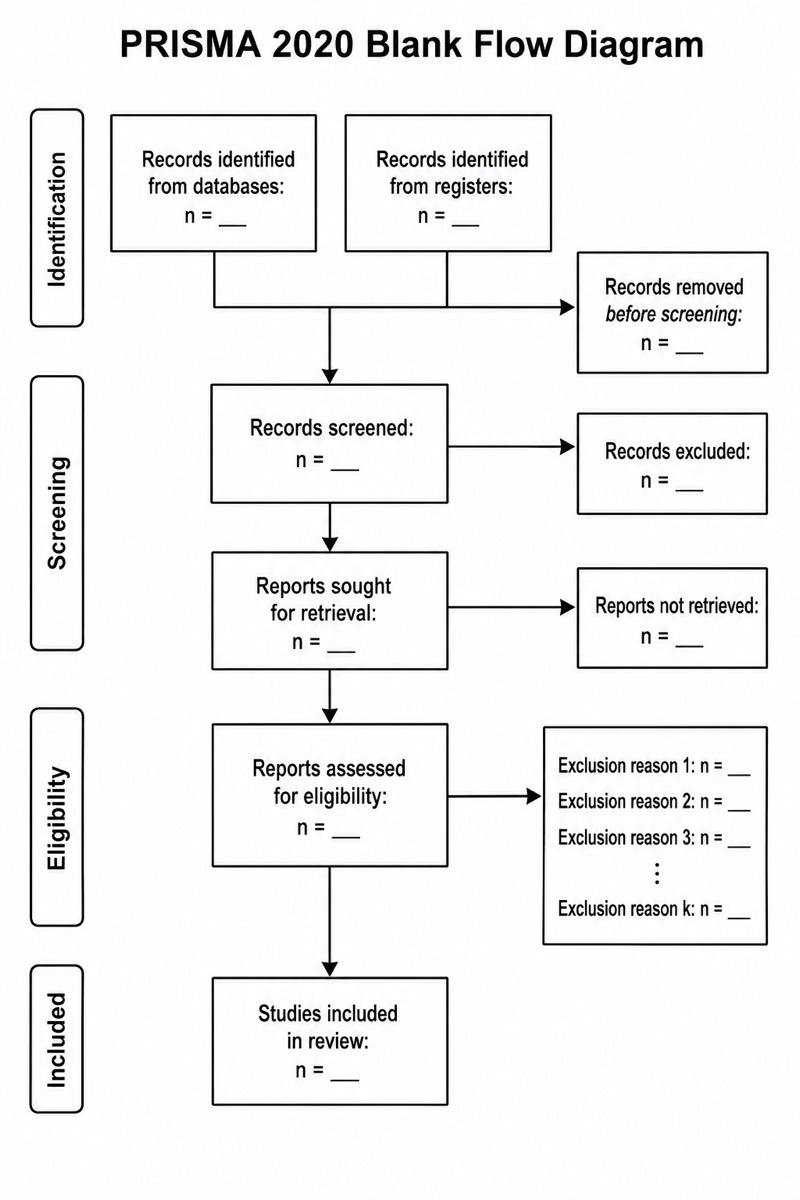
A PRISMA 2020 flow diagram documents how evidence moves from search results to the final set of studies included in a systematic review. It provides numerical transparency for four instructional stages: identification, screening, eligibility assessment, and inclusion. Each box reports a count using a placeholder such as “n =”. The diagram distinguishes records identified through databases or registers, records removed before screening, records screened by title and abstract, reports sought for retrieval, full-text reports assessed for eligibility, and studies finally included. It therefore allows readers to reconstruct the selection process and evaluate whether potentially relevant evidence was handled systematically.
The diagram is read from top to bottom, with arrows showing progressive filtering. Identification counts should first be adjusted for duplicate records and other records removed before screening. The remaining records undergo title-and-abstract screening, producing a documented number of exclusions. Potentially relevant reports are then sought and retrieved for full-text assessment; reports not retrieved must be counted separately. During eligibility assessment, excluded full-text reports are listed by mutually interpretable reasons, such as ineligible population, intervention, outcome, design, or publication type. The final box reports included studies, while separate counts may be required for included reports because one study can generate multiple publications.
What a correct diagram must include
- Identification sources and counts: Show records identified from each database, register, or other source with “n =” so the search yield can be traced.
- Pre-screening removals: Include duplicate records, records removed by automation tools, and records removed for other reasons, keeping these counts separate from screening exclusions.
- Title-and-abstract screening: State the number of unique records screened and the number excluded at this stage.
- Report retrieval: Show reports sought for retrieval and reports not retrieved, because inaccessible full texts are not equivalent to eligibility-based exclusions.
- Full-text eligibility assessment: Label the box as reports assessed for eligibility and provide the corresponding “n =” count.
- Full-text exclusion reasons: Place specific reasons and counts in a right-hand box, ensuring that their total equals the number of reports excluded after assessment.
- Final inclusion counts: Report the number of studies included in the review and, when applicable, the number of reports describing those studies.
- Arithmetic and arrow consistency: Make every downward transition numerically reconcilable and use arrows only for the actual sequence of record or report handling.
Common mistakes
- Using “records,” “reports,” and “studies” as interchangeable terms: records are search results, reports are documents, and studies are the underlying investigations.
- Subtracting duplicate records after title-and-abstract screening instead of documenting them as records removed before screening.
- Combining reports not retrieved with full-text reports excluded for eligibility reasons, although these represent different process outcomes.
- Listing vague exclusion reasons such as “irrelevant” or allowing the reason counts to disagree with the total number of excluded reports.
- Reporting only the final included count without preserving the numerical links among identification, screening, retrieval, assessment, and inclusion.
Teaching tips
Use the diagram after teaching search strategy design and study eligibility criteria, but before critical appraisal or meta-analysis. Give students an incomplete flow diagram and ask them to calculate missing values, distinguish records from reports and studies, and decide where duplicates or unavailable full texts belong. Follow with questions such as, “Which exclusions reflect search management, and which reflect eligibility decisions?” The diagram supports assessment of PRISMA 2020 terminology, numerical consistency, reproducibility, selection bias, and transparent reporting of the evidence-selection process.
FAQ about this diagram
What is the difference between a record, a report, and a study in a PRISMA 2020 flow diagram?
A record is a database or register entry, a report is a full document such as an article or thesis, and a study is the underlying investigation. Several reports may describe one study, so included report and included study counts can differ.
Where should duplicate records appear in the flow diagram?
Duplicates belong under records removed before screening. The number screened should equal the identified records minus duplicates and any other documented pre-screening removals.
How should full-text exclusion reasons be presented?
List specific, review-relevant reasons with a count for each, such as wrong population, intervention, outcome, study design, or publication type. Apply one primary reason per excluded report when possible, and ensure that the reason counts sum to the total reports excluded.