Detailed PRISMA Flow Diagram (University Level)
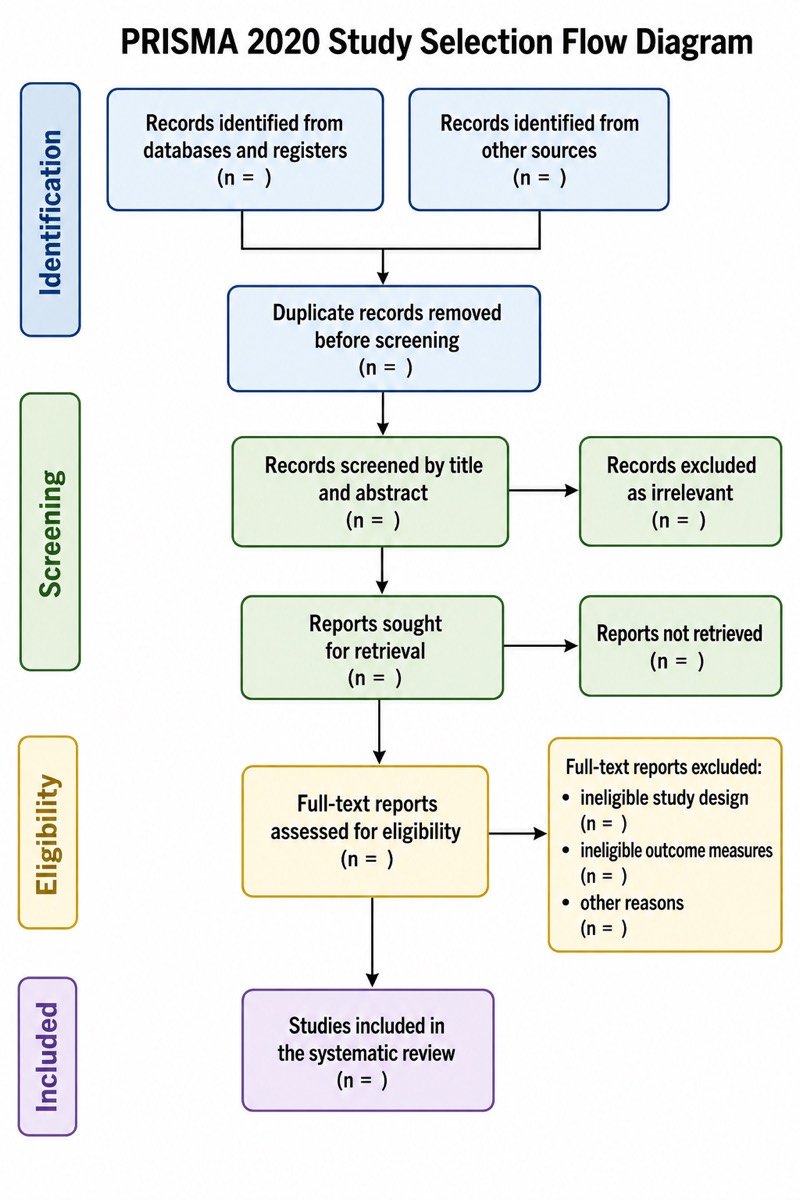
Detailed PRISMA Flow Diagram (University Level) — an alternative version of the PRISMA Flow Diagram for Systematic Reviews, generated by AI and fully editable. Download the PNG for quizzes, homework or slides.
Labels included in this diagram
- Identification
- Records identified from databases and registers (n = )
- Records identified from other sources (n = )
- Duplicate records removed before screening (n = )
- Records screened by title and abstract (n = )
- Screening
- Records excluded as irrelevant (n = )
- Reports sought for retrieval (n = )
- Reports not retrieved (n = )
- Eligibility
- Full-text reports assessed for eligibility (n = )
- Full-text reports excluded: ineligible study design (n = ); ineligible outcome measures (n = ); other reasons (n = )
- Included
- Studies included in the systematic review (n = )
✓ Accurate labels ✓ Edit text after generation ✓ PNG for papers, posters & slides
 OUTPUT · 16:9 · PNG
What this diagram shows
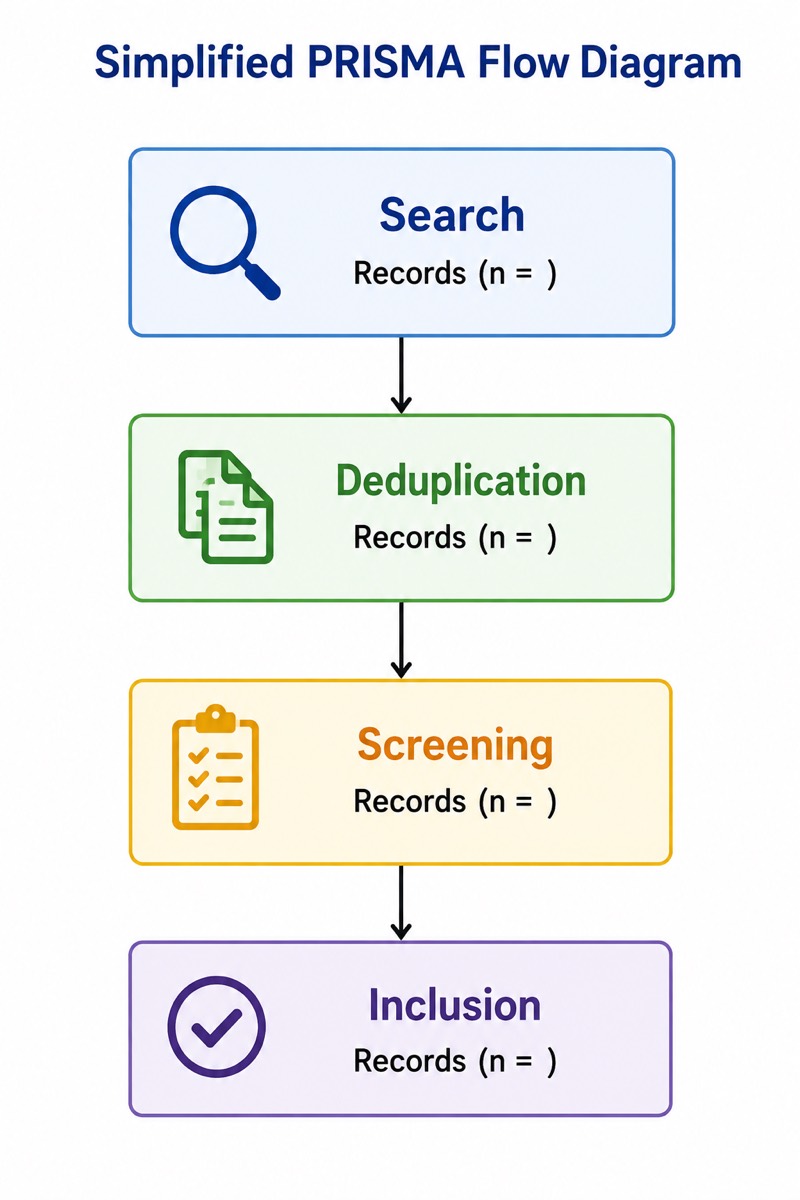
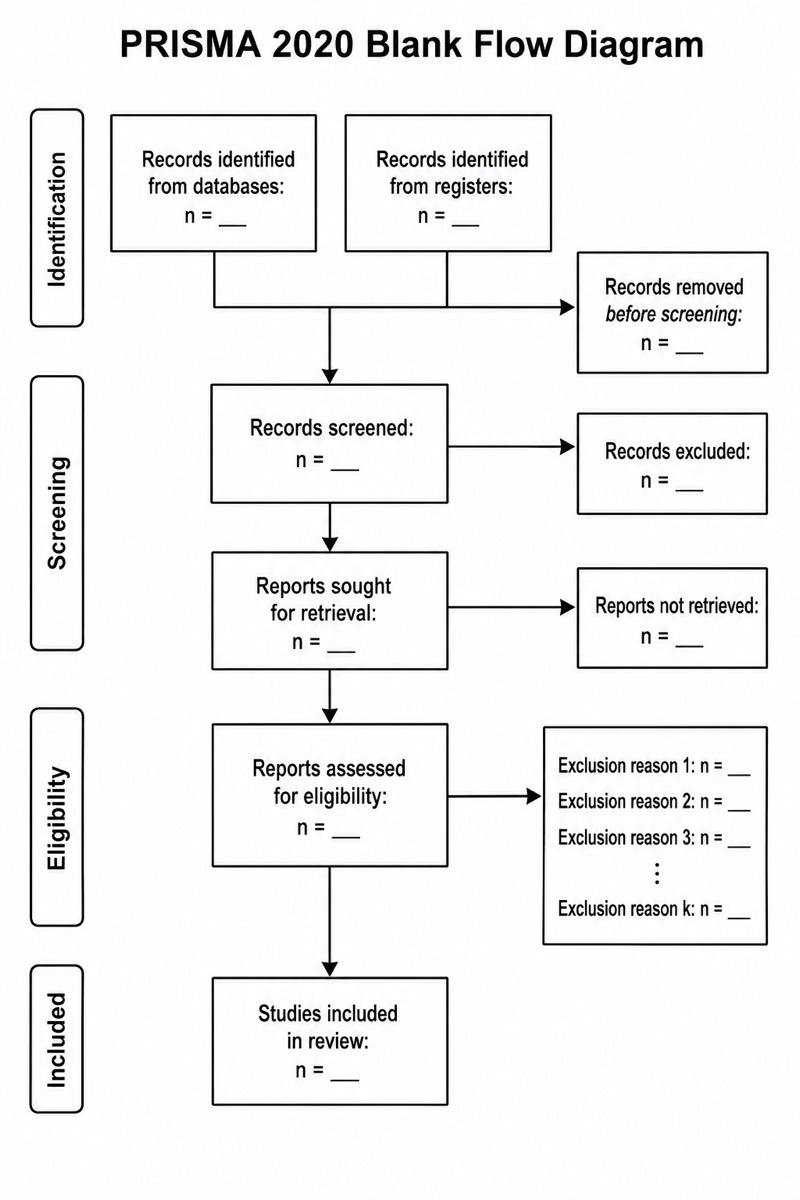
This Detailed PRISMA Flow Diagram (University Level) presents the complete literature-selection pathway for a systematic review. Unlike the standard overview, it separates records identified through databases and registers from those found through websites, organizations, citation searching, or other sources. More than twelve labeled structures trace identification, deduplication, title-and-abstract screening, report retrieval, full-text eligibility assessment, and final inclusion. Each box provides an n = placeholder, while side boxes distinguish duplicates, irrelevant citations, unavailable full texts, ineligible study designs, and mismatched outcomes. Use this version when the simplified main diagram does not provide enough methodological detail.
Read the diagram from top to bottom, beginning with the two identification columns and following the arrows as records are removed, screened, retrieved, assessed, and included. Enter actual counts in every n = field and verify that totals reconcile after each exclusion step. The right-hand lists document why records or reports leave the pathway rather than treating all exclusions as equivalent. Compared with the standard main figure, this detailed version supports auditability and teaches students to distinguish records, reports, and studies. It is therefore more suitable for university research methods, reproducible review reporting, and close analysis of PRISMA 2020 decisions.
Teaching tips
- In-class quiz: provide a partially completed diagram and ask students to calculate missing counts, identify the correct screening stage, and distinguish duplicate removal from eligibility exclusion.
- Homework assignment: have students convert a search log into the two-source pathway, entering database records, records from other methods, retrieved reports, excluded reports, and included studies.
- Lecture slides and revision outlines: use the labeled structures to explain the difference between records, reports, and studies, then compare this detailed version with the standard main diagram to show why simplified figures can hide key decisions.
- Thesis or journal figure: replace every n = placeholder with verified review counts, report full-text exclusion reasons separately, and check that the arithmetic remains consistent across identification, screening, eligibility, and inclusion.
- Printed handout: distribute the blank figure during a research-methods workshop so learners can annotate deduplication rules, retrieval failures, design criteria, outcome criteria, and the evidence retained for synthesis.
FAQ about this diagram
How does this university-level variant differ from a standard PRISMA flow diagram?
The standard main diagram is often simplified to emphasize the four broad phases. This variant adds separate identification routes, count checkpoints, report-retrieval decisions, and categorized exclusion reasons, making it better for teaching, methodological auditing, and formal research reporting.
Should every exclusion reason be shown in the detailed PRISMA flow diagram?
Routine record-level exclusions can be summarized numerically, but full-text exclusions should be grouped under explicit, mutually interpretable reasons such as ineligible design or outcome. The categories must match the review protocol, and their counts should sum to the total number of reports excluded after eligibility assessment.