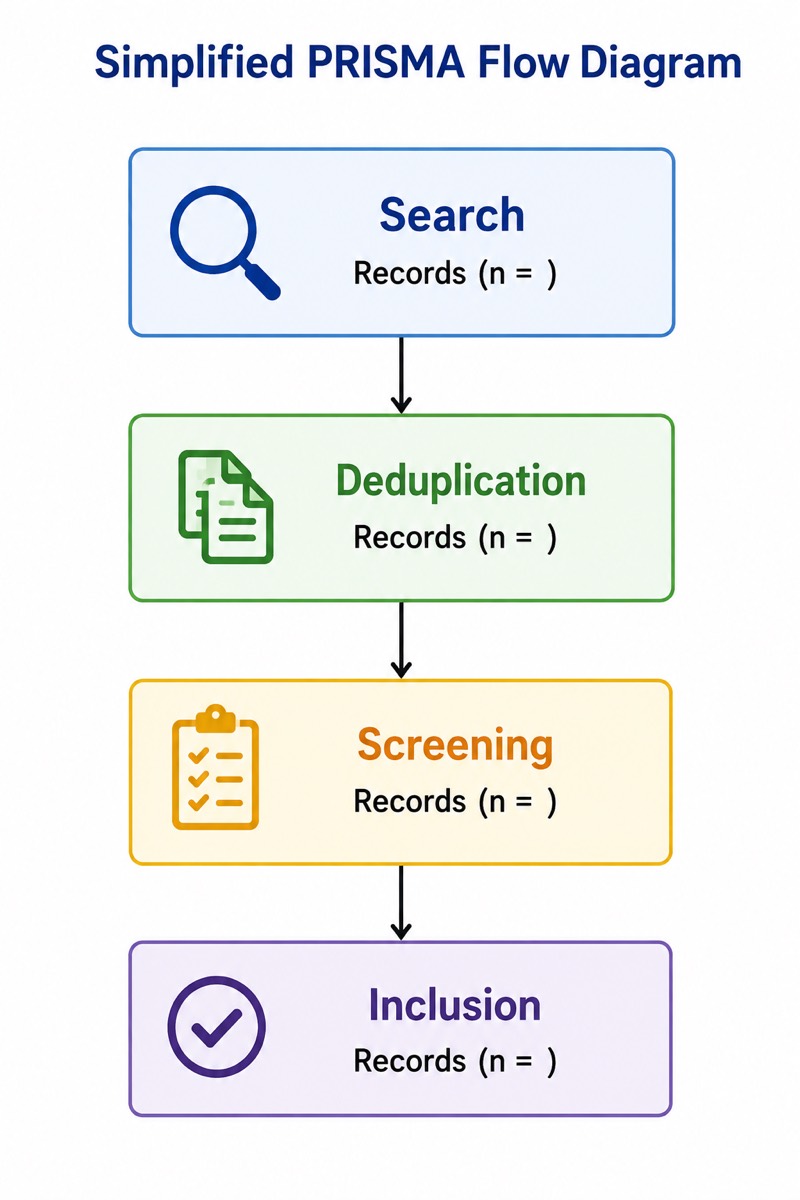
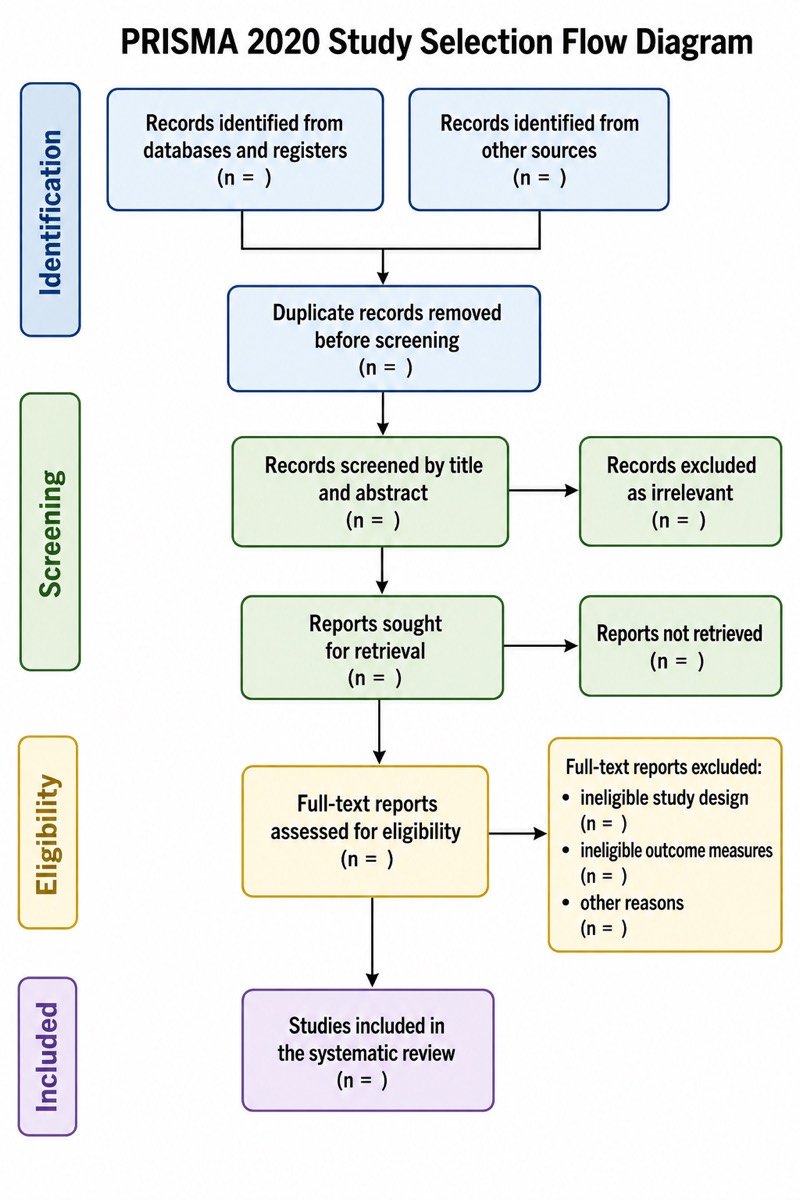
Blank PRISMA Flow Diagram Template
Blank PRISMA Flow Diagram Template — an alternative version of the PRISMA Flow Diagram for Systematic Reviews, generated by AI and fully editable. Download the PNG for quizzes, homework or slides.
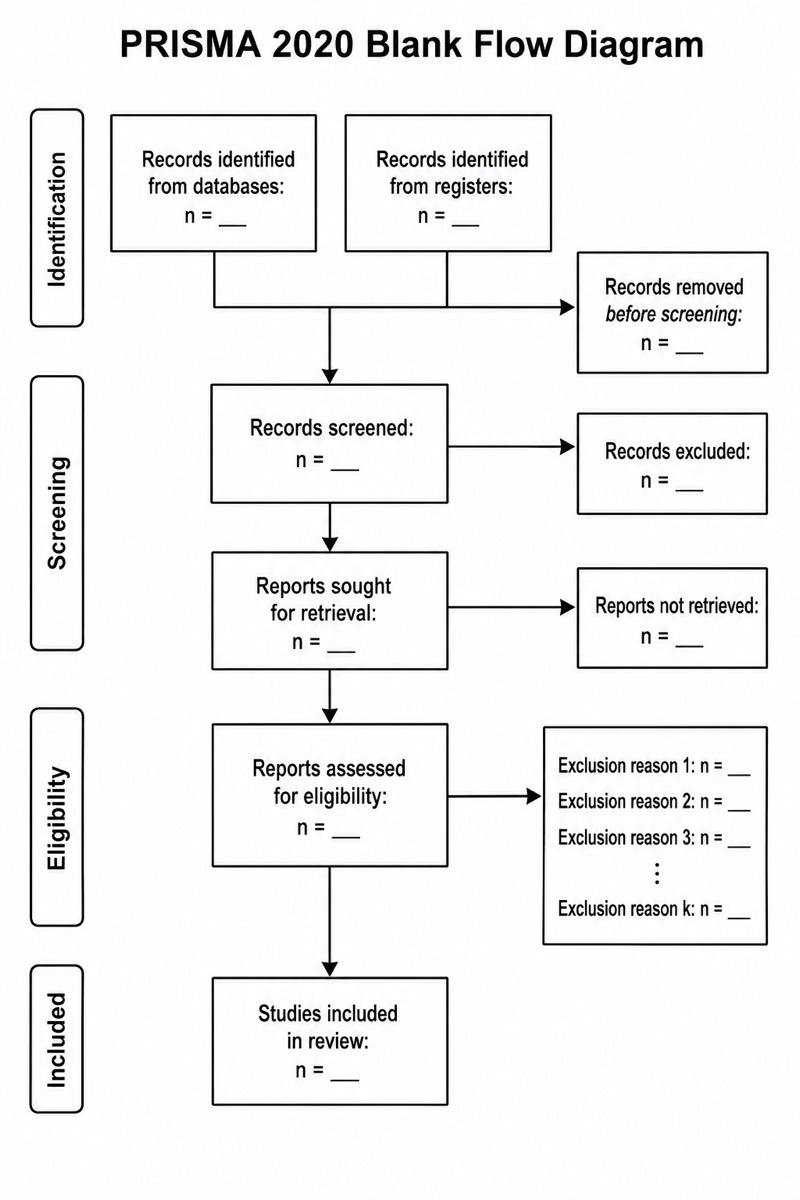
Labels included in this diagram
- Identification
- Screening
- Eligibility
- Included
- Records identified from databases: n = ___
- Records identified from registers: n = ___
- Records removed before screening: n = ___
- Records screened: n = ___
- Records excluded: n = ___
- Reports sought for retrieval: n = ___
- Reports not retrieved: n = ___
- Reports assessed for eligibility: n = ___
- Exclusion reason 1: n = ___
- Studies included in review: n = ___
✓ Accurate labels ✓ Edit text after generation ✓ PNG for papers, posters & slides
 OUTPUT · 16:9 · PNG
What this diagram shows
This blank PRISMA flow diagram template preserves the full black-and-white structure of a PRISMA 2020 study-selection flowchart, including the Identification, Screening, Eligibility, and Included stages, their boxes, arrows, and stage labels. Unlike the standard main diagram, which displays completed study counts and specific exclusion reasons, every numerical field here appears as n = ___. The exclusion boxes also use placeholders such as "Reason for exclusion 1: n = ___." This version is designed for completion rather than immediate interpretation, allowing learners and researchers to supply data without rebuilding the diagram.
Read the template from top to bottom, following the arrows as records move from database or register identification through duplicate removal, title-and-abstract screening, full-text eligibility assessment, and final inclusion. Enter a count in each n = ___ field, then check that totals remain consistent after every removal or exclusion step. In the right-hand boxes, replace each generic exclusion-reason line with a precise category and its count. Use this blank version when the purpose is to calculate, practise, plan, or handwrite the selection data; use the standard completed figure when reporting final review results.
Teaching tips
- In-class quizzes: give students database-search totals, duplicate counts, screening exclusions, and full-text decisions, then ask them to complete the n = ___ fields and verify that each transition is mathematically consistent.
- Homework and assessment: provide a short systematic-review scenario and require learners to fill the diagram, name appropriate full-text exclusion reasons, and distinguish records, reports, and included studies.
- Slides and revision outlines: place the empty flowchart beside an explanation of the four selection stages, revealing the correct counts step by step or using the placeholders as prompts for active recall.
- Manuscript figures and review planning: draft the selection pathway before final numbers are available, update the blank fields as screening progresses, and later replace the template with a completed diagram for publication.
- Printed handouts: distribute the black-and-white line diagram during workshops so participants can handwrite search results, removals, eligibility decisions, and reasons for exclusion while practising PRISMA reporting.
FAQ about this diagram
How is this blank template different from a standard PRISMA flow diagram?
The boxes, arrows, and selection stages are retained, but completed counts and review-specific exclusion reasons are removed. Every quantity is shown as n = ___, so the figure functions as a worksheet or drafting framework rather than a finished report.
Can the blank PRISMA flow diagram template be used as the final figure in a paper?
Only after every placeholder has been replaced with verified counts and specific exclusion reasons. Before submission, confirm that the pathway matches the actual search sources and selection process, that totals reconcile between boxes, and that terminology is consistent with the reporting guidance used by the review.