Graphical Abstract: Drug Development Process Generator
Free online Graphical Abstract: Drug Development Process generator: get a fully labeled figure in about 90 seconds. The AI plans the must-have label list first, then renders a clean textbook-style diagram — every label editable afterwards, ready for papers, assignments and slides.
Labels included in this diagram
- Target identification
- Target validation
- Compound screening
- Lead optimization
- Animal studies
- Clinical trials
- Regulatory review
- Market approval
✓ Accurate labels ✓ Edit text after generation ✓ PNG for papers, posters & slides
 OUTPUT · 16:9 · PNG
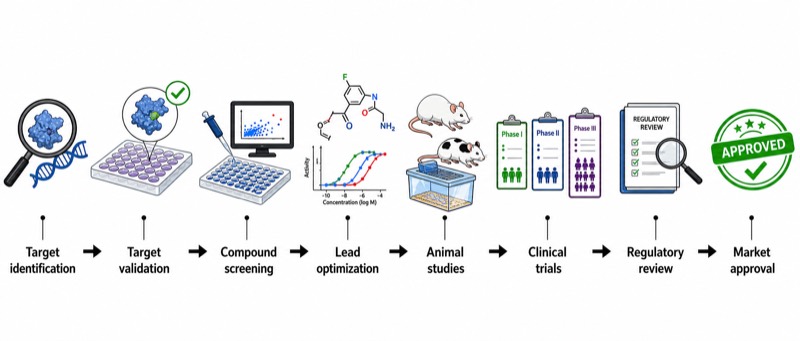
What this diagram shows
This graphical abstract summarizes the scientific pathway by which a therapeutic concept progresses from biological discovery to an approved medicine. It begins with Target identification, where disease-associated genes, proteins, or pathways are selected, followed by Target validation to establish causal relevance and therapeutic tractability. Compound screening then identifies molecules that modulate the target, while Lead optimization improves potency, selectivity, pharmacokinetics, and safety. Animal studies evaluate in vivo efficacy, toxicity, and exposure. Clinical trials test the investigational drug in humans, Regulatory review assesses the complete evidence package, and Market approval authorizes clinical use under specified conditions.
The stages should be arranged as a left-to-right sequence connected by arrows, but the diagram should also indicate that drug development is iterative rather than strictly linear. Results from Compound screening may require renewed Target validation, while findings from Animal studies or Clinical trials may return a candidate to Lead optimization. Decision gates separate discovery, preclinical development, clinical development, and regulatory assessment. Attrition should be visually implied because most targets and compounds do not reach approval. Clinical trials may be subdivided into Phase I, Phase II, and Phase III to show the progression from initial safety and dose evaluation to efficacy confirmation and benefit-risk assessment.
What a correct diagram must include
- A clear left-to-right workflow: connect all stages with directional arrows so that the temporal and causal progression is immediately readable.
- Target identification and Target validation as separate steps: show that discovering a disease-associated target is different from demonstrating its causal relevance and druggability.
- Compound screening: include a library, plate, or molecular icon to represent experimental or computational screening for target-modulating hits.
- Lead optimization: depict chemical refinement and label the major objectives, such as potency, selectivity, ADME properties, pharmacokinetics, and reduced toxicity.
- Animal studies: identify this stage as preclinical in vivo testing of efficacy, exposure, dose-response relationships, and toxicological risk.
- Clinical trials: distinguish Phase I, Phase II, and Phase III, or summarize them with annotations for safety, preliminary efficacy, and confirmatory benefit-risk evidence.
- Regulatory review and Market approval: show review before approval and indicate that approval depends on an integrated assessment of quality, safety, and efficacy.
- Feedback loops and attrition points: add return arrows or decision gates to communicate that candidates can fail, be modified, or require additional evidence.
Common mistakes
- Combining Target identification with Target validation, which incorrectly implies that biological association alone proves therapeutic relevance.
- Placing Animal studies before Lead optimization without showing candidate selection, causing an unrefined screening hit to appear ready for preclinical development.
- Representing Clinical trials as a single experiment and omitting the distinct objectives of Phase I, Phase II, and Phase III.
- Drawing Regulatory review after Market approval, reversing the required relationship between evidence assessment and authorization.
- Using only a straight success pathway with no attrition or feedback, which conceals the iterative optimization and high failure rate of drug development.
Teaching tips
Use the graphical abstract after introducing target-based drug discovery or as a synthesis activity at the end of a pharmacology module. Ask students to explain what evidence is required to pass each decision gate, why a validated target may still fail during screening, and how pharmacokinetic or toxicological findings can redirect Lead optimization. The figure can support examination questions on target validation, hit-to-lead progression, preclinical-to-clinical translation, clinical trial phases, and regulatory benefit-risk assessment. Students may also annotate likely failure points and propose appropriate feedback arrows.
FAQ about this diagram
Why must Target identification and Target validation be shown as separate stages?
Target identification establishes an association between a biological entity and a disease phenotype. Target validation tests whether modulating that entity produces the predicted therapeutic effect with acceptable specificity and feasibility.
What is the difference between Compound screening and Lead optimization?
Compound screening identifies initial hits that affect the target or phenotype. Lead optimization iteratively modifies selected chemical series to improve potency, selectivity, solubility, metabolic stability, pharmacokinetics, and safety.
Does successful completion of Animal studies guarantee success in Clinical trials?
No. Animal models may not fully reproduce human disease biology, metabolism, toxicity, or treatment response. Clinical trials are therefore required to establish human safety, dose, efficacy, and overall benefit-risk balance.