Cladogram Generator
Free online Cladogram generator: get a fully labeled figure in about 90 seconds. The AI plans the must-have label list first, then renders a clean textbook-style diagram — every label editable afterwards, ready for papers, assignments and slides.
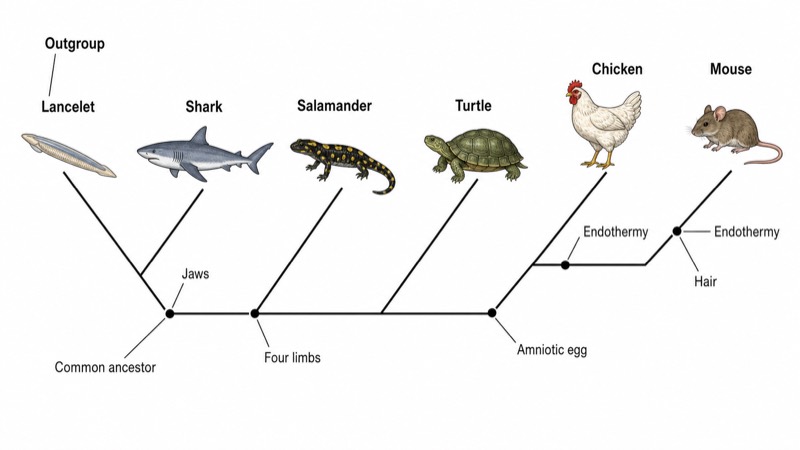
Labels included in this diagram
- Outgroup
- Lancelet
- Shark
- Salamander
- Turtle
- Chicken
- Mouse
- Common ancestor
- Jaws
- Four limbs
- Amniotic egg
- Endothermy
- Hair
✓ Accurate labels ✓ Edit text after generation ✓ PNG for papers, posters & slides
 OUTPUT · 16:9 · PNG
What this diagram shows
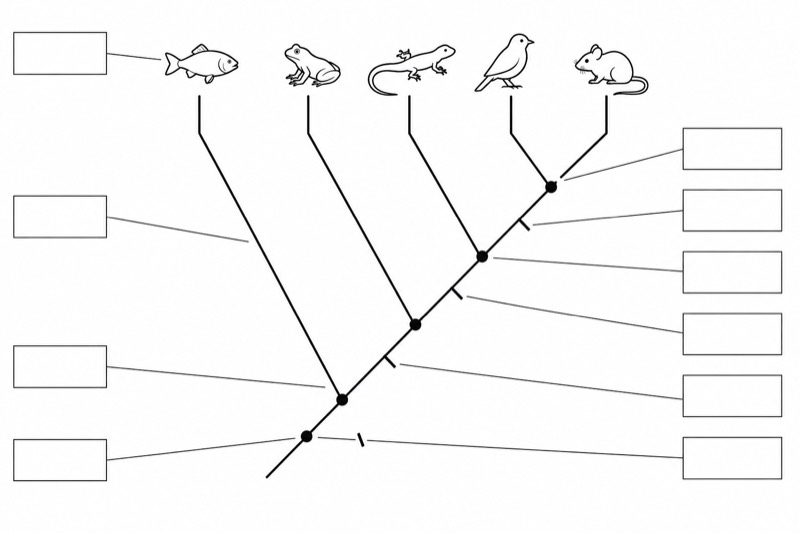
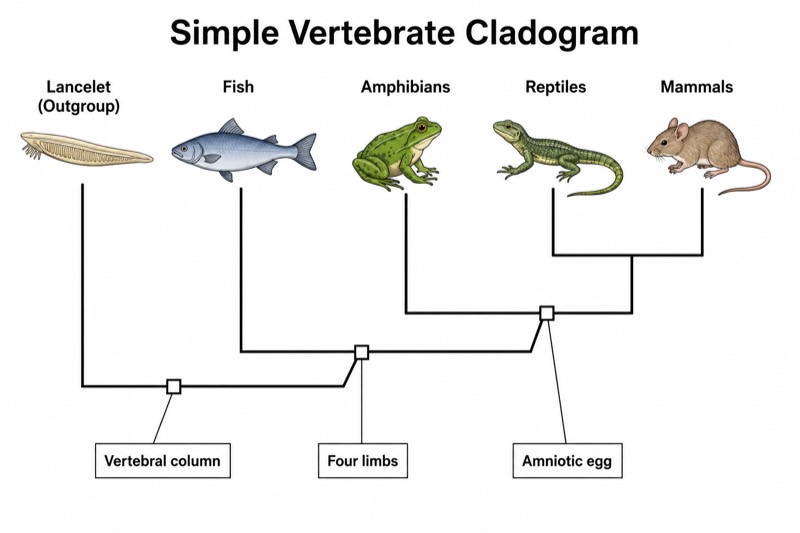
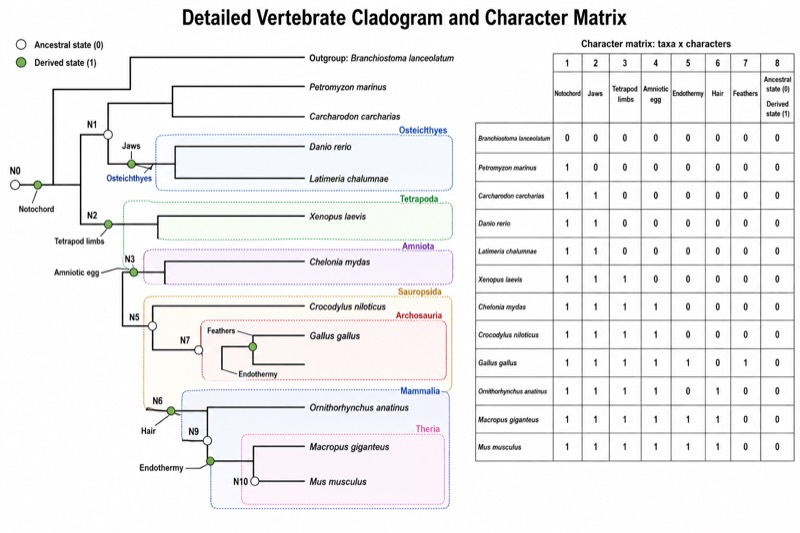
A cladogram represents a hypothesis about evolutionary relationships among taxa based on shared derived characters, or synapomorphies. The outgroup provides a reference for identifying ancestral and derived character states, while the ingroup contains the taxa being compared. Each internal node represents the most recent common ancestor of the descendant lineages branching from it. Character markers, such as the amniotic egg, endothermy, or hair, are placed where each trait is inferred to have originated. The diagram emphasizes branching order and nested clades rather than absolute evolutionary time, genetic distance, or overall similarity.
Read a staircase-style cladogram from the root toward the terminal taxa. A derived character placed on a branch is generally inherited by all descendants above that point unless a later loss or independent origin is indicated. Two taxa sharing an immediate node are sister taxa; together with their common ancestor, they form a clade. More inclusive clades originate at deeper nodes and contain smaller nested clades. Rotating branches around a node does not change the relationships. Trait placement should follow the most parsimonious explanation while recognizing that homoplasy, including convergent evolution and character reversal, may require multiple changes.
What a correct diagram must include
- Terminal taxa: Place each species or taxonomic group at a branch tip so the organisms being compared are unambiguous.
- Outgroup: Include a taxon outside the ingroup to root the cladogram and help determine which character states are ancestral.
- Root: Mark the basal point from which all represented lineages descend; it establishes the direction used to interpret character change.
- Branches: Draw continuous lines connecting ancestors and descendants, remembering that line length has no meaning unless a scale is explicitly provided.
- Internal nodes: Show every inferred common ancestor at a branching point, with each node ideally dividing into two descendant lineages.
- Shared derived characters: Place synapomorphies, such as the amniotic egg or hair, on the branch where they are inferred to have originated.
- Nested clades: Arrange taxa so every valid clade includes a common ancestor and all of its descendants.
- Character evidence: Use a character-state matrix or equivalent dataset to justify the branching pattern rather than arranging taxa by appearance alone.
Common mistakes
- Treating adjacent tip labels as closest relatives even when they do not share the most recent node.
- Reading the staircase as a ladder of progress and assuming taxa near the top are more evolved than those near the root.
- Interpreting branch length or horizontal spacing as elapsed time or amount of evolutionary change when no scale is given.
- Placing a derived trait beside only one taxon even though the trait originated on a branch ancestral to several descendant taxa.
- Using analogous traits, such as independently evolved endothermy, as unquestioned evidence of common ancestry without considering homoplasy.
Teaching tips
Use the cladogram after introducing homologous characters, synapomorphies, and common ancestry. Ask students to identify the outgroup, locate sister taxa, name the descendants of a selected node, and determine which organisms should possess a marked trait. Then rotate one or more branches and ask whether the topology has changed. For assessment, connect the diagram to character-state matrices, monophyletic groups, parsimony, homoplasy, and the distinction between a cladogram and a time-scaled phylogenetic tree. Students can also justify an alternative topology using explicit character evidence.
FAQ about this diagram
What does an internal node represent in a cladogram?
An internal node represents the inferred most recent common ancestor of all lineages descending from that point. It is a branching event in the phylogenetic hypothesis, not necessarily a known fossil species.
Why is an outgroup included?
The outgroup roots the cladogram and helps polarize character states. A state shared with the outgroup is usually inferred to be ancestral, while a different ingroup state may be treated as derived.
Does a derived character always appear only once?
Not necessarily. Parsimony often favors the fewest changes, but convergence, parallel evolution, and evolutionary reversal can produce homoplasy. For example, endothermy may need to be mapped as independent origins in birds and mammals, depending on the taxa and evidence included.