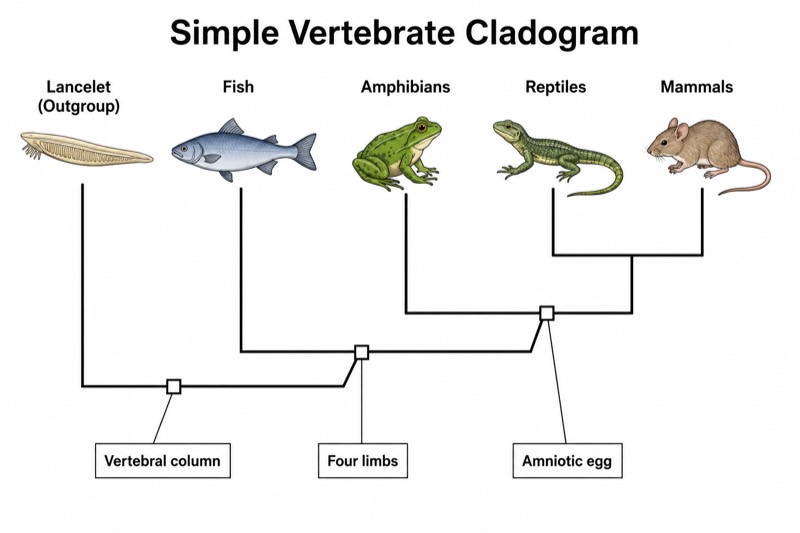
Detailed Cladogram (University Level)
Detailed Cladogram (University Level) — an alternative version of the Cladogram, generated by AI and fully editable. Download the PNG for quizzes, homework or slides.
Labels included in this diagram
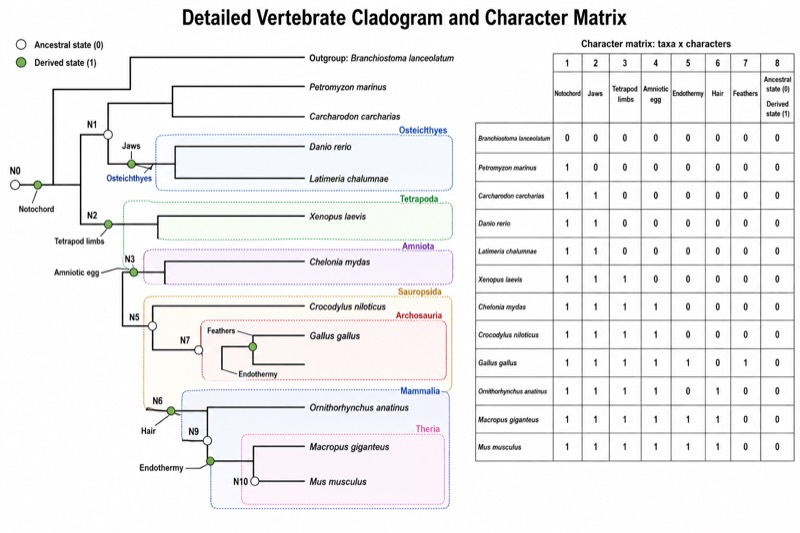
- Outgroup: Branchiostoma lanceolatum
- Terminal taxa: Petromyzon marinus; Carcharodon carcharias; Danio rerio; Latimeria chalumnae; Xenopus laevis; Chelonia mydas; Crocodylus niloticus; Gallus gallus; Ornithorhynchus anatinus; Macropus giganteus; Mus musculus
- Common ancestor nodes: N0-N10
- Notochord
- Jaws
- Tetrapod limbs
- Amniotic egg
- Endothermy
- Hair
- Feathers
- Ancestral state (0)
- Derived state (1)
- Monophyletic clades: Gnathostomata; Osteichthyes; Tetrapoda; Amniota; Sauropsida; Archosauria; Mammalia; Theria
- Character matrix: taxa x characters
✓ Accurate labels ✓ Edit text after generation ✓ PNG for papers, posters & slides
 OUTPUT · 16:9 · PNG
What this diagram shows
This detailed cladogram presents a stepwise phylogeny of more than ten taxa, beginning with an outgroup and marking numbered common-ancestor nodes. Unlike the standard overview, it labels research-level structures and character transitions, including notochord, jaws, four limbs, amniotic egg, endothermy, hair, and feathers. It also distinguishes ancestral character states, or plesiomorphies, from derived states, or apomorphies, and outlines selected monophyletic groups. Use this version when the simplified main diagram does not provide enough evidence for evaluating clade membership, character polarity, or competing evolutionary interpretations.
Read from the root toward the terminal taxa, treating each node as the most recent common ancestor of all descendant branches rather than as a living species. Match each character marker to the corresponding column in the adjacent character matrix, then identify which taxa share the derived state. The outgroup helps infer whether a state is ancestral or derived, while monophyletic-group boxes test whether an ancestor and all its descendants are included. This detailed cladogram (university level) is preferable to the standard figure when students must justify relationships from character evidence and recognize convergence, reversal, or independent origins such as endothermy.
Teaching tips
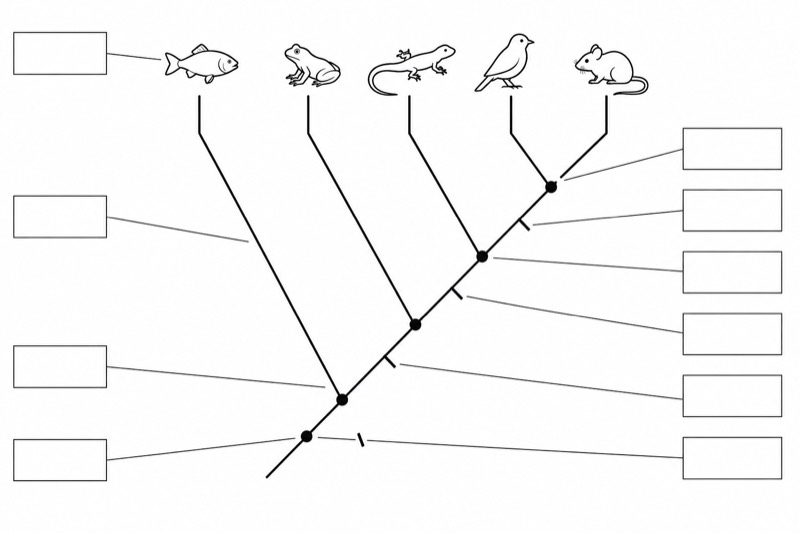
- In-class assessment: remove selected node numbers, synapomorphy labels, or monophyletic-group boxes and ask students to restore them using the branching pattern and character matrix. Unlike the standard main diagram, this version supports evidence-based questions rather than simple vocabulary recall.
- Homework and laboratory analysis: have students code ancestral and derived states for each taxon, map notochord, jaws, limbs, amniotic egg, hair, and feathers onto the tree, and flag characters that may show homoplasy. The added matrix makes the reasoning traceable.
- Lecture slides: reveal the outgroup, numbered nodes, character transitions, and clade boxes in stages. Use the detailed version after the standard overview to explain why shared ancestry is determined by branching order, not by superficial similarity or left-to-right position.
- Revision handout or printed worksheet: print the figure beside prompts asking for sister taxa, the most recent common ancestor, synapomorphies, plesiomorphies, and the membership of named monophyletic groups. The noncrossing leaders and formal labels remain legible during close annotation.
- Research report or thesis figure: adapt the topology and character matrix to summarize a stated morphological hypothesis, define taxon sampling, and cite the data source and analytical method in the caption. This version is suitable because it exposes character support, whereas the standard main figure is primarily conceptual.
FAQ about this diagram
Why include both a cladogram and a character matrix?
The matrix records the observed character states, while the cladogram shows the phylogenetic hypothesis inferred from those data. Their side-by-side placement allows readers to check whether each proposed synapomorphy actually supports the indicated node and to identify possible homoplasy or missing data.
Does a trait marker mean that every descendant expresses the trait identically?
No. A marker indicates that a derived state is inferred to have originated on that branch, but descendants may later modify or lose it. Traits such as endothermy may also evolve independently, so they should not be treated as a single synapomorphy unless the stated analysis supports that interpretation.