Wave Interference and Diffraction Generator
Free online Wave Interference and Diffraction generator: get a fully labeled figure in about 90 seconds. The AI plans the must-have label list first, then renders a clean textbook-style diagram — every label editable afterwards, ready for papers, assignments and slides.
Labels included in this diagram
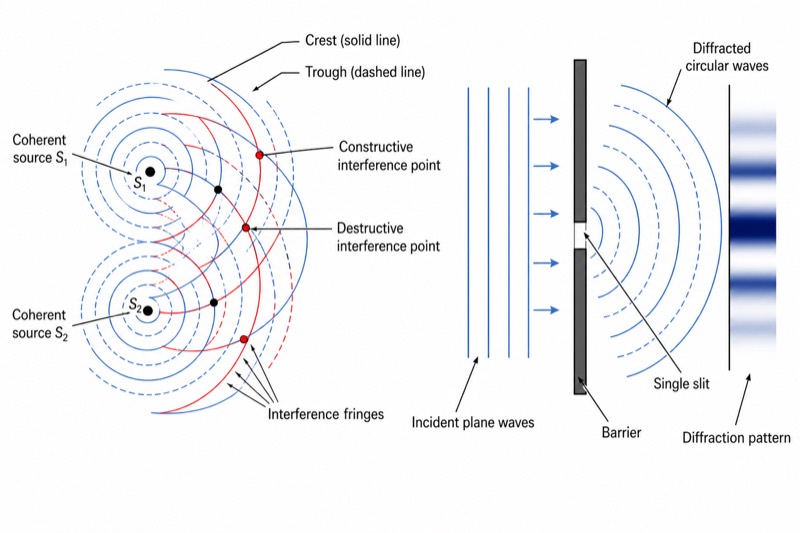
- Coherent source S1
- Coherent source S2
- Crest (solid line)
- Trough (dashed line)
- Constructive interference point
- Destructive interference point
- Interference fringes
- Incident plane waves
- Single slit
- Barrier
- Diffracted circular waves
- Diffraction pattern
✓ Accurate labels ✓ Edit text after generation ✓ PNG for papers, posters & slides
 OUTPUT · 16:9 · PNG
What this diagram shows
This diagram presents two central wave phenomena in the high-school optional physics curriculum: interference and diffraction. On the left, two coherent sources, S1 and S2, emit circular water waves with the same frequency and a constant phase difference. Their wavefronts are shown as solid crest lines and dashed trough lines. Where crests meet crests or troughs meet troughs, constructive interference forms antinodal regions; where a crest meets a trough, destructive interference forms nodal regions. On the right, plane water waves pass through a single slit and spread into curved wavefronts, demonstrating diffraction.
The interference pattern is determined by the path difference from S1 and S2 to each observation point. Constructive interference occurs when the path difference is mλ, while destructive interference occurs when it is (m + 1/2)λ, assuming the sources are in phase. The alternating antinodal and nodal lines extend outward from the source region. In the single-slit section, the slit acts as a set of secondary wave sources. The outgoing waves bend into the shadow region, producing a broad central maximum and weaker side maxima. Diffraction becomes more obvious when the slit width is comparable to the wavelength.
What a correct diagram must include
- Show two coherent point sources, S1 and S2, separated by a clear distance; they must have the same frequency and a constant phase relationship.
- Draw circular wavefronts centered on each source with equal spacing; equal spacing represents a single wavelength and keeps the wave speed and frequency consistent.
- Use solid lines for crests and dashed lines for troughs; alternating wavefront types make the phase relationship visible.
- Mark constructive-interference regions where crest–crest or trough–trough overlaps occur; these regions form antinodal lines with maximum amplitude.
- Mark destructive-interference regions where crest–trough overlaps occur; these nodal lines represent minimum or zero resultant amplitude.
- Label interference fringes or bands as alternating antinodal and nodal regions rather than as individual wavefronts, because a fringe is a locus of points with the same interference condition.
- For single-slit diffraction, draw incident plane waves, a finite slit, and curved wavefronts spreading behind it; the pattern must visibly enter the geometrical shadow region.
- Indicate a broad central diffraction maximum and weaker side maxima, and show that a narrower slit produces greater angular spreading.
Common mistakes
- Drawing the two sources with different wavelengths or irregular wavefront spacing, which destroys the required coherent-source condition.
- Calling every solid crest line an interference fringe; a crest is a wavefront, whereas an antinodal fringe is a region or locus produced by repeated superposition.
- Placing destructive-interference lines where two crests meet; crest–crest and trough–trough combinations are constructive, while crest–trough combinations are destructive.
- Drawing diffraction as waves travelling only straight ahead through the slit, without curved wavefronts in the shadow region.
- Showing the single-slit central maximum as narrower than the side maxima; for a typical single-slit pattern, the central maximum is the widest and brightest region.
Teaching tips
Use the diagram after introducing superposition and before applying quantitative conditions. Ask students to trace the distances from S1 and S2 to a selected point and decide whether the path difference is mλ or (m + 1/2)λ. Then ask why a slit comparable with the wavelength produces strong spreading. The figure supports exam questions on coherent sources, path difference, nodes, antinodes, fringe spacing, and the relationship between slit width and diffraction angle.
FAQ about this diagram
Why must S1 and S2 be coherent sources?
They must have the same frequency and a constant phase difference so that the interference pattern remains stable. Independent sources usually have changing phase relationships and do not produce fixed nodal and antinodal lines.
What is the difference between an interference fringe and a wavefront?
A wavefront joins points in the same phase, such as successive crests. An interference fringe is a region or line of constant resultant amplitude, such as an antinodal line or a nodal line created by superposition.
Why does a narrower slit produce stronger diffraction?
Diffraction becomes significant when the slit width is comparable with the wavelength. Reducing the slit width increases the angular spread, so the central maximum becomes wider and the wave penetrates farther into the geometrical shadow.