Detailed Water Cycle Diagram (University Level)
Detailed Water Cycle Diagram (University Level) — an alternative version of the Water Cycle Diagram, generated by AI and fully editable. Download the PNG for quizzes, homework or slides.
Labels included in this diagram
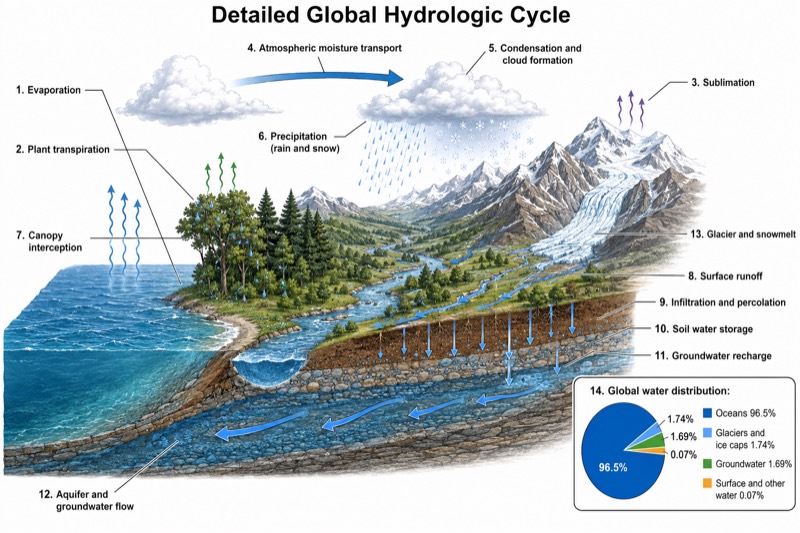
- Evaporation
- Plant transpiration
- Sublimation
- Atmospheric moisture transport
- Condensation and cloud formation
- Precipitation (rain and snow)
- Canopy interception
- Surface runoff
- Infiltration and percolation
- Soil water storage
- Groundwater recharge
- Aquifer and groundwater flow
- Glacier and snowmelt
- Global water distribution: oceans 96.5%; glaciers and ice caps 1.74%; groundwater 1.69%; surface and other water 0.07%
✓ Accurate labels ✓ Edit text after generation ✓ PNG for papers, posters & slides
 OUTPUT · 16:9 · PNG
What this diagram shows
This detailed water cycle diagram (university level) expands the standard overview into a process-based Earth-system model. In addition to evaporation, transpiration, precipitation, surface runoff, infiltration, and groundwater flow, it identifies sublimation, atmospheric moisture transport, condensation, cloud formation, rain and snow, interception, soil water, aquifers, groundwater recharge, and glacier and snowpack melt. Mountain, ocean, vegetation, soil, and subsurface zones show where each transfer occurs. A global water-distribution inset adds quantitative context. Unlike the standard main diagram, this version separates closely related pathways so students can analyze reservoirs, fluxes, and interactions precisely.
Read the figure by tracing arrows from a water reservoir to the process that transfers water into another reservoir. Distinguish atmospheric fluxes from surface, cryospheric, soil, and groundwater pathways, then compare short-term processes such as interception with slower aquifer recharge and groundwater flow. The uncrossed leader lines support accurate identification of more than twelve labeled structures. Use the global water-allocation inset to compare saline water, freshwater, ice, and groundwater storage. This version is preferable to the standard main diagram when an assignment requires scientific terminology, pathway classification, quantitative interpretation, or discussion of coupled atmospheric and hydrologic systems.
Teaching tips
- In-class quiz: remove selected labels and ask students to identify processes, classify each as storage or transfer, and reconstruct the sequence from evaporation to groundwater discharge.
- Homework: have students compare this university-level version with the standard main diagram, listing the added pathways and explaining why interception, sublimation, soil water, and groundwater recharge matter in a complete water budget.
- Lecture slides: reveal atmospheric, surface, subsurface, and cryospheric pathways in stages so students can follow fluxes without confusing condensation, cloud formation, precipitation, infiltration, and recharge.
- Review outline or printed handout: annotate each reservoir with likely residence time, and use colored pencils to separate atmospheric transport, land-surface flow, groundwater movement, and phase changes.
- Research paper or laboratory report: use the diagram as a conceptual framework for defining system boundaries, identifying measured hydrologic variables, and relating a local catchment study to global water-distribution proportions.
FAQ about this diagram
How is this detailed water cycle diagram different from a standard water cycle diagram?
A standard diagram usually emphasizes a small set of major processes, whereas this version separates atmospheric transport, phase changes, vegetation interception, soil storage, groundwater recharge, aquifer flow, and cryospheric melting. It is used when students must analyze water reservoirs and fluxes rather than simply memorize the basic cycle.
Why include a global water-distribution inset in a process diagram?
The inset distinguishes the volume stored in oceans from the much smaller freshwater fraction held in ice, groundwater, surface water, and other reservoirs. It helps prevent a common misconception: a visually prominent pathway in the cycle does not necessarily contain a large proportion of Earth's total water.