Acid-Base Titration Curve Generator
Free online Acid-Base Titration Curve generator: get a fully labeled figure in about 90 seconds. The AI plans the must-have label list first, then renders a clean textbook-style diagram — every label editable afterwards, ready for papers, assignments and slides.
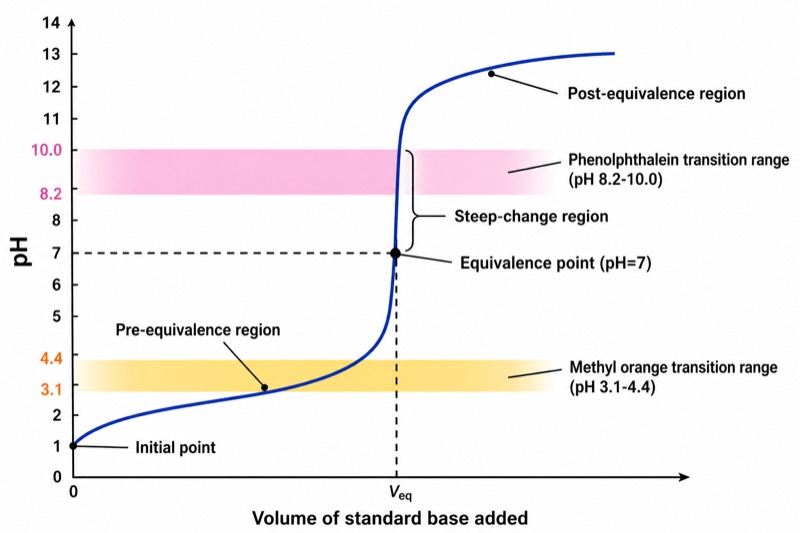
Labels included in this diagram
- pH
- Volume of standard base added
- Initial point
- Pre-equivalence region
- Steep-change region
- Equivalence point (pH=7)
- Post-equivalence region
- Methyl orange transition range (pH 3.1-4.4)
- Phenolphthalein transition range (pH 8.2-10.0)
✓ Accurate labels ✓ Edit text after generation ✓ PNG for papers, posters & slides
 OUTPUT · 16:9 · PNG
What this diagram shows
An acid–base titration curve shows how the solution pH changes as a measured volume of standard acid or base is added to an analyte. With volume on the x-axis and pH on the y-axis, the curve usually changes slowly at first, then passes through a steep equivalence region, and finally levels off. For a strong acid–strong base titration, the equivalence point is approximately pH 7.00 at 25 °C because neither conjugate ion undergoes significant hydrolysis. A true buffer region is not present in this strong–strong system; it belongs mainly to weak acid–strong base or weak base–strong acid titrations.
The curve represents the stoichiometric and equilibrium sequence of the titration. Before the equivalence point, the excess analyte controls the pH. In a weak acid or weak base titration, the partially neutralized mixture contains a conjugate acid–base pair, producing a buffer region in which pH changes gradually. Near the chemical equivalence point, the amounts of acid and base are related by the balanced equation, so a small volume change causes a large pH change. Beyond equivalence, the excess standard solution determines the pH. Indicator transition ranges should be placed within the steep region to minimize endpoint error.
What a correct diagram must include
- Label the x-axis as volume of standard solution added, usually in mL, because the independent variable is the delivered titrant volume.
- Label the y-axis as pH and use a clearly ordered scale from acidic to basic values, because the vertical coordinate represents hydrogen-ion activity approximately through pH = −log[H⁺].
- Mark the initial pH before titrant is added, because it identifies the starting analyte and establishes the first point of the curve.
- Show the gradual region and the steep pH jump, because the slope becomes greatest near the chemical equivalence point.
- Mark the equivalence point at the stoichiometric volume, not simply at the midpoint of the drawing; for a strong acid–strong base titration, its pH is about 7 at 25 °C.
- Distinguish a genuine buffer region from the strong–strong curve: buffer behavior requires appreciable amounts of a weak acid/base and its conjugate partner.
- Plot methyl orange at approximately pH 3.1–4.4 and phenolphthalein at approximately pH 8.2–10.0, then check whether each transition range lies inside the steep section.
- Indicate the post-equivalence region, where excess titrant controls pH and the curve gradually approaches the titrant's limiting acidity or basicity.
Common mistakes
- Drawing a buffer region on a strong acid–strong base curve as though every titration contains a buffer; strong electrolytes do not form a significant conjugate acid–base buffer pair.
- Placing the equivalence point at pH 7 for every titration; pH 7 is characteristic of strong acid–strong base systems at 25 °C, whereas weak acid–strong base equivalence is above 7 and weak base–strong acid equivalence is below 7.
- Confusing the equivalence point with the indicator endpoint; the equivalence point is stoichiometric, while the endpoint is the observed color change and may differ slightly.
- Putting an indicator range outside the steep pH jump or treating the entire range as a single point; the indicator should change color over a range that produces minimal volume error.
- Reversing the curve without changing the chemistry; adding standard acid to a base gives a decreasing pH curve, whereas adding standard base to an acid gives an increasing curve.
Teaching tips
Use the diagram after students review neutralization equations and before quantitative titration calculations. Ask: Which species controls pH before, at, and after equivalence? Why is the strong acid–strong base equivalence point near pH 7? Which indicator gives the smaller endpoint error, and does that choice change for weak acid–strong base titration? Have students estimate the equivalence volume from the steep region, compare it with the balanced-equation ratio, and explain why the selected indicator transition must overlap the vertical section. This connects graphical interpretation with stoichiometry, equilibrium, buffers, and experimental error.
FAQ about this diagram
Why is the equivalence point of a strong acid–strong base titration near pH 7?
At equivalence, the acid and base have reacted in stoichiometric amounts. The solution mainly contains water and spectator ions, so at 25 °C the pH is approximately 7, although temperature and concentration can cause small deviations.
What is the difference between the equivalence point and the endpoint?
The equivalence point is the theoretical volume at which the reacting amounts satisfy the balanced chemical equation. The endpoint is the experimentally observed indicator color change, so a suitable indicator is chosen to make the difference between them as small as possible.
Why can both methyl orange and phenolphthalein be shown on one strong acid–strong base curve?
A strong acid–strong base titration has a very steep pH change around equivalence, so both methyl orange, about pH 3.1–4.4, and phenolphthalein, about pH 8.2–10.0, may change color within that steep region. Their suitability depends on the curve's steepness and the required accuracy.