Plate Tectonics Diagram Generator
Free online Plate Tectonics Diagram generator: get a fully labeled figure in about 90 seconds. The AI plans the must-have label list first, then renders a clean textbook-style diagram — every label editable afterwards, ready for papers, assignments and slides.
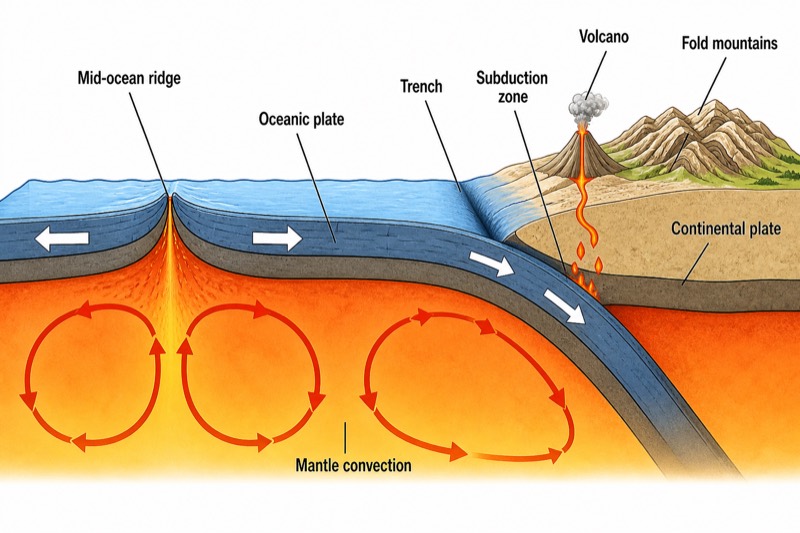
Labels included in this diagram
- Mid-ocean ridge
- Trench
- Subduction zone
- Continental plate
- Oceanic plate
- Mantle convection
- Volcano
- Fold mountains
✓ Accurate labels ✓ Edit text after generation ✓ PNG for papers, posters & slides
 OUTPUT · 16:9 · PNG
What this diagram shows
A plate tectonics diagram shows how rigid lithospheric plates move above the softer asthenosphere. In cross-section, it should include an oceanic plate, a continental plate, a mid-ocean ridge, a trench, a subduction zone, volcanoes, fold mountains, and mantle convection. The mid-ocean ridge represents a constructive boundary, where magma rises and cools to form new oceanic crust. The trench and subduction zone represent a destructive boundary, where denser oceanic lithosphere sinks beneath another plate. This model helps students connect plate motion with seafloor spreading, earthquakes, volcanic activity, crustal recycling, and mountain building.
The process begins beneath the lithosphere, where heat-driven mantle convection is commonly used as a simplified explanation for plate movement. At the mid-ocean ridge, rising mantle material partially melts, magma reaches the surface, and new basaltic crust forms as the plates diverge. The oceanic plate then moves away from the ridge, cools, thickens, and becomes denser. Where it meets a continental plate, it bends downward to create a deep-ocean trench and descends through the subduction zone. Water released from the sinking slab promotes melting above it, feeding volcanoes. Compression near the continental margin deforms rock layers and may produce fold mountains.
What a correct diagram must include
- Lithosphere and asthenosphere: Draw rigid plates above a weaker upper-mantle layer so that plate motion is not mistakenly shown within the crust alone.
- Mid-ocean ridge: Place an elevated submarine ridge at the divergent boundary, with plates moving apart and magma rising through the central rift.
- New oceanic crust: Show symmetrical bands or newly formed crust on both sides of the ridge to represent seafloor spreading.
- Oceanic and continental plates: Make the oceanic crust thinner and denser, while the continental crust is thicker and generally less dense.
- Trench and subduction zone: Draw a narrow trench where the oceanic plate bends downward, then trace the inclined slab beneath the overriding plate.
- Mantle convection: Use curved arrows beneath the plates to indicate rising and sinking material, while noting that real plate-driving forces also include slab pull and ridge push.
- Volcanoes and fold mountains: Position volcanoes above the descending slab and folded mountain belts near the compressed continental margin.
- Movement arrows and labels: Clearly distinguish divergence at the constructive boundary from convergence and crustal destruction at the destructive boundary.
Common mistakes
- Drawing the continental plate beneath the oceanic plate, even though the denser oceanic lithosphere normally subducts at an oceanic-continental convergent boundary.
- Placing the trench far from the point where the oceanic plate bends downward; the trench marks the surface expression of subduction.
- Showing magma rising directly from the sinking slab; melting mainly occurs in the mantle wedge above the slab after water lowers the melting temperature.
- Drawing new crust at the trench or destroying crust at the mid-ocean ridge, which reverses the roles of constructive and destructive boundaries.
- Using arrows that show both plates moving in the same direction without indicating relative divergence or convergence at the boundary.
Teaching tips
Use the diagram after introducing Earth's internal structure and before comparing boundary types. Ask students to trace one section of oceanic lithosphere from its formation at the mid-ocean ridge to its destruction in the subduction zone. Questions such as “Where is crust created?”, “Why does the oceanic plate sink?”, and “Why are volcanoes inland from the trench?” reveal misconceptions. The diagram supports assessment of constructive and destructive boundaries, seafloor spreading, crustal density, earthquake distribution, volcanic arcs, and fold-mountain formation.
FAQ about this diagram
Why does the oceanic plate subduct beneath the continental plate?
Oceanic lithosphere is usually thinner but denser than continental lithosphere, especially after it cools and ages. At convergence, negative buoyancy helps pull the oceanic plate into the mantle.
What is the difference between a trench and a subduction zone?
A trench is the narrow, deep depression at the seafloor where a plate begins to bend downward. The subduction zone is the larger inclined region through which the plate descends beneath the overriding plate.
How are volcanoes and fold mountains related to subduction?
Fluids released from the descending slab promote partial melting in the mantle wedge, producing magma that may feed volcanoes. At the same time, compression shortens and folds crustal rocks, contributing to mountain building.