Carbon Cycle Diagram Generator
Free online Carbon Cycle Diagram generator: get a fully labeled figure in about 90 seconds. The AI plans the must-have label list first, then renders a clean textbook-style diagram — every label editable afterwards, ready for papers, assignments and slides.
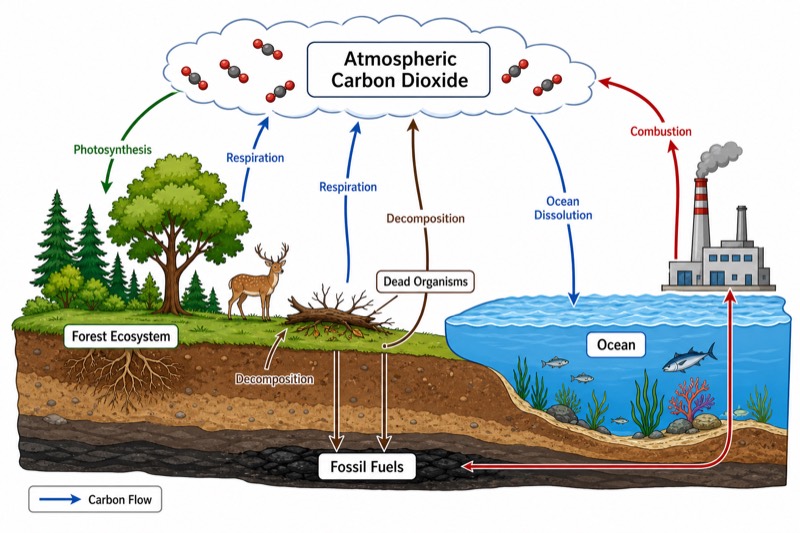
Labels included in this diagram
- Atmospheric Carbon Dioxide
- Photosynthesis
- Respiration
- Combustion
- Fossil Fuels
- Ocean Dissolution
- Decomposition
- Dead Organisms
- Forest Ecosystem
- Ocean
- Carbon Flow
✓ Accurate labels ✓ Edit text after generation ✓ PNG for papers, posters & slides
 OUTPUT · 16:9 · PNG
What this diagram shows
A carbon cycle diagram shows how carbon moves among the atmosphere, living organisms, oceans, soils, and geological stores. Atmospheric carbon dioxide is absorbed by plants through photosynthesis and converted into organic matter. Carbon then passes through food chains and returns to the atmosphere through respiration, decomposition, and combustion. Dead organisms may be broken down by decomposers or, over geological time, contribute to the formation of fossil fuels. The diagram should distinguish carbon stores from processes and use labeled arrows to show the direction of carbon transfer.
The main logic is a network of transfers rather than a single sequence. Photosynthesis moves carbon from atmospheric carbon dioxide into plants, while feeding transfers it to animals. Plant, animal, and microbial respiration release carbon dioxide back into the atmosphere. Death produces biological remains, which undergo decomposition; decomposers release carbon through respiration, while some carbon is stored in soils or buried sediments. Combustion of biomass and fossil fuels rapidly returns stored carbon to the atmosphere. Oceans exchange carbon dioxide with the atmosphere through dissolution and release, and marine organisms may transfer some dissolved carbon into shells, sediments, and long-term geological storage.
What a correct diagram must include
- Atmospheric carbon dioxide: place it as a major carbon store and connect it to both carbon-removing and carbon-releasing processes.
- Photosynthesis: draw an arrow from atmospheric carbon dioxide to green plants or forest vegetation because producers fix inorganic carbon into organic compounds.
- Respiration: show arrows from plants, animals, and decomposers back to the atmosphere because cellular respiration releases carbon dioxide.
- Biological remains and decomposition: connect dead organisms to decomposers, soil carbon, and atmospheric carbon dioxide to show carbon recycling after death.
- Fossil fuels and combustion: show long-term burial leading toward fossil fuel stores, then draw a combustion arrow from fossil fuels to atmospheric carbon dioxide.
- Ocean dissolution and exchange: include arrows between the atmosphere and ocean surface because carbon dioxide can dissolve in seawater and can also return to the air.
- Carbon-flow arrows: use clear arrowheads and process labels so that every transfer identifies both its direction and its mechanism.
- Forest and ocean systems: include both landscapes to represent terrestrial and marine carbon stores rather than presenting the cycle as land-based only.
Common mistakes
- Drawing photosynthesis from plants toward the atmosphere; the carbon-flow arrow should point from atmospheric carbon dioxide into producers.
- Using one respiration arrow only for animals; plants and decomposers also carry out cellular respiration and release carbon dioxide.
- Showing fossil fuels forming directly from recently dead organisms; fossilization requires burial, suitable conditions, and geological timescales.
- Drawing ocean uptake as a one-way process; air–sea carbon dioxide exchange can occur in both directions depending on physical and chemical conditions.
- Confusing decomposition with combustion; decomposition is biological breakdown, whereas combustion is rapid oxidation of biomass or fossil fuels.
Teaching tips
Use the diagram after introducing photosynthesis and respiration, or as a synthesis activity at the end of an ecosystems unit. Ask students to identify each carbon store, classify arrows as biological, physical, or human-influenced processes, and trace one carbon atom through several possible pathways. Questions can compare fast transfers, such as respiration, with slow transfers, such as fossil fuel formation. The diagram also supports assessment of matter cycling, ecosystem interdependence, combustion, decomposition, ocean–atmosphere exchange, and the causes of rising atmospheric carbon dioxide.
FAQ about this diagram
Is the carbon cycle a fixed sequence of processes?
No. It is a network in which carbon can follow many pathways among the atmosphere, organisms, oceans, soils, and rocks. A diagram should therefore use branching and returning arrows rather than one circular chain.
Why should respiration be shown for plants as well as animals?
Plants perform both photosynthesis and cellular respiration. Photosynthesis stores carbon in organic molecules, while respiration breaks down organic molecules and releases carbon dioxide.
What is the difference between decomposition and fossil fuel formation?
Decomposition rapidly breaks down biological remains and returns much of their carbon to the atmosphere or soil. Fossil fuel formation occurs only when some organic material is buried and transformed over millions of years.