Vertical Layers of the Atmosphere Generator
Free online Vertical Layers of the Atmosphere generator: get a fully labeled figure in about 90 seconds. The AI plans the must-have label list first, then renders a clean textbook-style diagram — every label editable afterwards, ready for papers, assignments and slides.
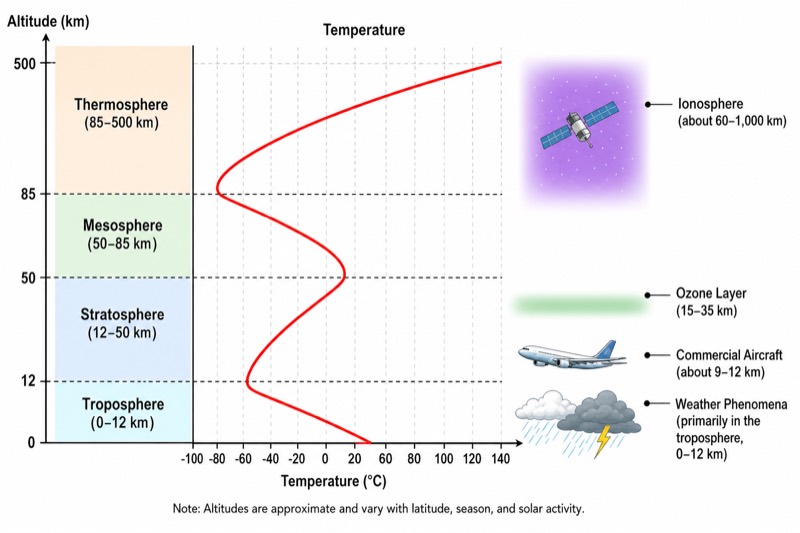
Labels included in this diagram
- Troposphere (0–12 km)
- Stratosphere (12–50 km)
- Mesosphere (50–85 km)
- Thermosphere (85–500 km)
- Temperature
- Altitude (km)
- Ozone Layer (15–35 km)
- Ionosphere (about 60–1,000 km)
- Weather Phenomena
- Commercial Aircraft (about 9–12 km)
✓ Accurate labels ✓ Edit text after generation ✓ PNG for papers, posters & slides
 OUTPUT · 16:9 · PNG
What this diagram shows
This diagram shows the atmosphere as a set of layers arranged by altitude and separated mainly according to how air temperature changes with height. From the surface upward, the troposphere contains most atmospheric mass, water vapour, clouds and weather. The stratosphere contains the ozone layer, which absorbs much ultraviolet radiation and causes temperature to rise upward. In the mesosphere, temperature falls again and many meteoroids burn because of friction and collisions with air molecules. The thermosphere has extremely thin air and temperatures rise sharply as high-energy solar radiation is absorbed. The ionosphere overlaps the mesosphere and thermosphere and contains electrically charged particles.
The diagram should combine three kinds of information: vertical position, altitude boundaries and physical processes. The temperature curve changes direction at the tropopause, stratopause and mesopause, so each turning point marks a boundary between layers. Ozone concentration is greatest in the stratosphere, while ionisation becomes especially important higher up. Weather occurs mainly in the troposphere because convection, water vapour and pressure differences drive clouds, winds and precipitation there. Commercial aircraft commonly cruise near the upper troposphere or lower stratosphere, where the air is thinner and conditions are often more stable, but this does not mean that all weather is absent at those heights.
What a correct diagram must include
- Four main layers—troposphere, stratosphere, mesosphere and thermosphere—must be placed from lowest to highest so the vertical sequence is scientifically clear.
- Altitude ranges should be shown approximately: troposphere 0–8 km near the poles and 0–18 km near the Equator, stratosphere about 12–50 km, mesosphere 50–85 km, and thermosphere from about 85 km upward.
- The temperature trend must be drawn correctly: decreasing in the troposphere, increasing in the stratosphere, decreasing in the mesosphere and increasing in the thermosphere.
- The ozone layer should be placed mainly in the stratosphere, roughly 15–35 km above Earth, because ozone absorbs ultraviolet radiation there.
- The ionosphere should be shown as an overlapping region rather than a separate layer with sharp boundaries, mainly across the upper mesosphere and thermosphere.
- Weather phenomena should be located primarily in the troposphere, where water vapour, convection, clouds, precipitation and strong vertical mixing are concentrated.
- Aircraft should be drawn near the upper troposphere or lower stratosphere, with a note that this indicates common cruising altitude rather than a strict atmospheric boundary.
Common mistakes
- Drawing all four layers with equal thickness is misleading because their actual altitude ranges and boundary heights are different.
- Reversing the stratospheric and mesospheric temperature trends produces an incorrect curve: temperature rises in the stratosphere but falls in the mesosphere.
- Treating the ionosphere as one of the four main temperature-based layers ignores that it overlaps several layers and is defined by ionisation.
- Placing clouds and most weather in the stratosphere is incorrect; nearly all ordinary weather develops in the troposphere.
- Drawing the ozone layer at the ground or throughout the whole atmosphere confuses concentrated stratospheric ozone with trace ozone found elsewhere.
Teaching tips
Use the diagram during the introduction to build a vertical framework, then ask students to trace the temperature curve upward and explain every rise or fall. Follow with questions such as: Why is weather concentrated in the troposphere? Why does temperature increase in the stratosphere? Why is the ionosphere drawn across more than one layer? The figure supports examination topics including atmospheric structure, ozone absorption of ultraviolet radiation, temperature inversions, air pressure decrease with height, and the relationship between altitude and atmospheric processes.
FAQ about this diagram
Why does temperature increase with height in the stratosphere?
Ozone absorbs ultraviolet radiation from the Sun and converts part of that energy into heat. Because ozone absorption is concentrated in the stratosphere, temperature generally increases upward there.
Is the ionosphere a separate atmospheric layer?
No. The ionosphere is a region of ionised particles that overlaps mainly the mesosphere and thermosphere. It is classified by electrical properties, whereas the four main layers in this diagram are mainly identified by temperature trends.
Why does most weather occur in the troposphere?
The troposphere contains most atmospheric mass and almost all atmospheric water vapour. Uneven heating creates convection, pressure differences and winds, allowing clouds, precipitation and storms to develop.