Periodic Trends Generator
Free online Periodic Trends generator: get a fully labeled figure in about 90 seconds. The AI plans the must-have label list first, then renders a clean textbook-style diagram — every label editable afterwards, ready for papers, assignments and slides.
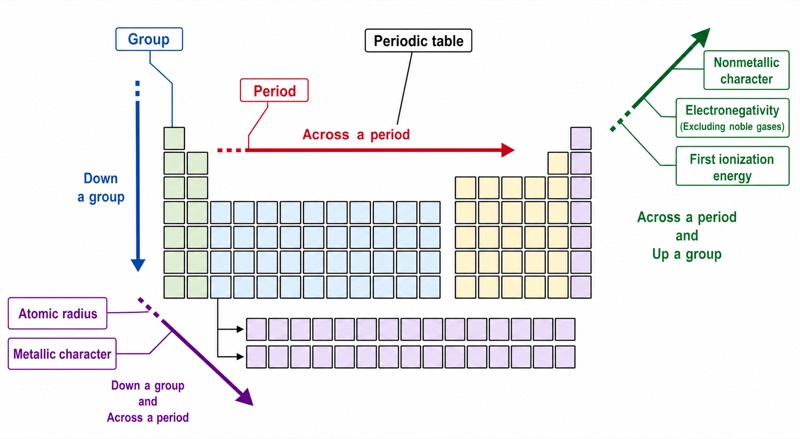
Labels included in this diagram
- Periodic table
- Period
- Group
- Atomic radius
- Metallic character
- Nonmetallic character
- Electronegativity
- First ionization energy
- Across a period
- Down a group
✓ Accurate labels ✓ Edit text after generation ✓ PNG for papers, posters & slides
 OUTPUT · 16:9 · PNG
What this diagram shows
The diagram uses a simplified periodic-table grid to show how major atomic properties vary across a period and down a main group. Atomic radius generally decreases from left to right but increases from top to bottom. Metallic character follows the same overall direction as atomic radius: it increases toward the lower-left corner. Nonmetallic character, electronegativity, and first ionization energy generally increase toward the upper-right corner. Each arrow should represent the direction in which a property increases, allowing students to compare elements by position without memorizing every numerical value.
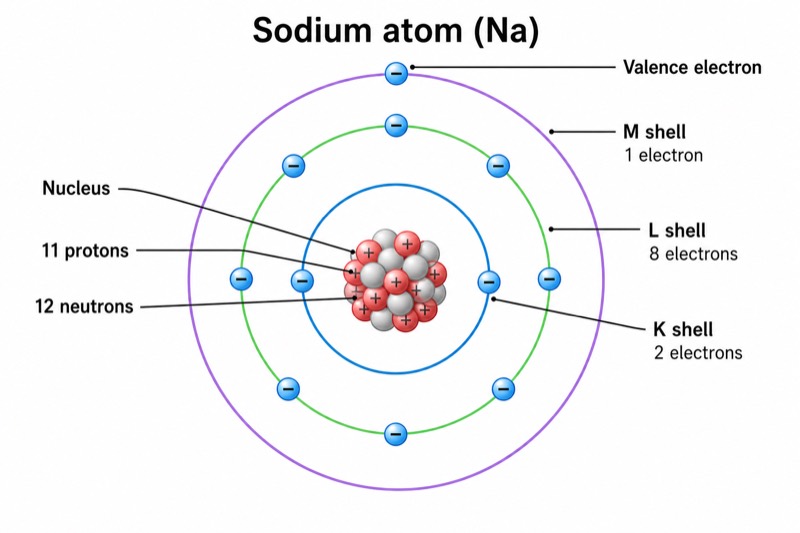
Across a period, nuclear charge increases while electrons are added to the same principal energy level. The stronger effective nuclear charge pulls the electron cloud inward, reducing atomic radius and generally increasing electronegativity and first ionization energy. Down a main group, additional occupied electron shells increase shielding and place valence electrons farther from the nucleus. Atomic radius and metallic character therefore increase, whereas electronegativity and first ionization energy generally decrease. Nonmetallic character is opposite to metallic character because elements that attract and retain electrons strongly are more likely to form negative ions or covalent bonds.
What a correct diagram must include
- Simplified periodic-table grid: include several periods and the main-group columns so both horizontal and vertical trends can be read clearly.
- Direction key: state that every arrow points toward increasing values; otherwise, the same arrow may be interpreted as a direction of decrease.
- Atomic radius arrows: draw the increase toward the left across a period and downward within a main group.
- Metallic character arrows: point toward the lower-left corner because atoms there lose valence electrons more readily.
- Nonmetallic character arrows: point toward the upper-right corner, opposite to metallic character, while treating noble gases separately.
- Electronegativity arrows: show an increase to the right and upward, with fluorine near the maximum and noble gases usually excluded.
- First ionization energy arrows: show the general increase to the right and upward, and label it as a trend with known local exceptions.
- Scientific explanation: connect horizontal trends to increasing effective nuclear charge and vertical trends to additional shells and stronger shielding.
Common mistakes
- Drawing arrows without labeling them as directions of increase, which makes the intended trend ambiguous.
- Showing atomic radius increasing toward the upper-right; its general increase is toward the lower-left.
- Treating metallic character and nonmetallic character as increasing in the same direction, although their trends are generally opposite.
- Applying electronegativity values to noble gases without qualification; many school-level tables leave their electronegativities undefined.
- Presenting first ionization energy as perfectly regular and ignoring common exceptions such as Be–B, N–O, Mg–Al, and P–S.
Teaching tips
Use the diagram after students have reviewed atomic structure, electron shells, and valence electrons. First hide the arrows and ask students to predict which of two elements has the larger radius or stronger metallic character. Then reveal the trends and require explanations using effective nuclear charge, shielding, and distance from the nucleus. Link the diagram to examination questions on comparing atomic radius, ionization energy, electronegativity, metal reactivity, and nonmetal reactivity. Emphasize that arrows show general trends rather than exception-free numerical rules.
FAQ about this diagram
Why does atomic radius decrease from left to right across a period?
Proton number increases, but the added electrons enter the same principal energy level. The resulting increase in effective nuclear charge attracts the electron cloud more strongly and reduces the atomic radius.
Why do atomic radius and first ionization energy usually change in opposite directions?
A smaller radius places valence electrons closer to the nucleus, where they experience stronger electrostatic attraction. More energy is therefore required to remove the first electron, so first ionization energy generally increases as radius decreases.
Why does first ionization energy have exceptions within a period?
Subshell energy and electron pairing also affect electron removal. For example, a p electron may be easier to remove than an s electron, and repulsion between paired electrons can lower the energy required to remove one electron.