Organizational Chart Generator
Free online Organizational Chart generator: get a fully labeled figure in about 90 seconds. The AI plans the must-have label list first, then renders a clean textbook-style diagram — every label editable afterwards, ready for papers, assignments and slides.
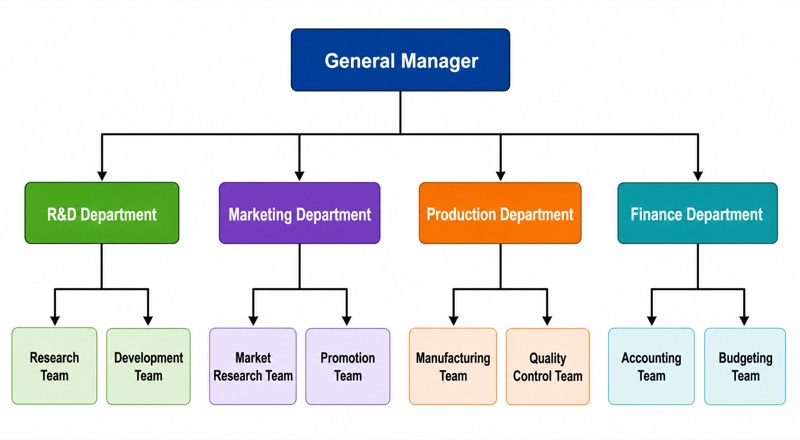
Labels included in this diagram
- General Manager
- R&D Department
- Marketing Department
- Production Department
- Finance Department
- Research Team
- Development Team
- Market Research Team
- Promotion Team
- Manufacturing Team
- Quality Control Team
- Accounting Team
- Budgeting Team
✓ Accurate labels ✓ Edit text after generation ✓ PNG for papers, posters & slides
 OUTPUT · 16:9 · PNG
What this diagram shows
An organization chart is a visual model of an organization’s formal structure. It shows the top-level authority, major departments, subordinate teams, job titles, and official reporting relationships. In this example, the General Manager occupies the highest position. Research and Development, Marketing, Production, and Finance are placed beneath that role as functional departments. Each department contains two smaller teams, creating a multi-level hierarchy. The chart represents formal authority and responsibility rather than every informal relationship among employees. Its main purpose is to make organizational design visible, so viewers can identify who supervises whom, how work units are grouped, and where decision-making responsibility is concentrated.
The structure is read from top to bottom and from parent node to child nodes. A connecting line from the General Manager to a department indicates a formal reporting relationship and managerial responsibility. Lines from each department to its two teams show delegation within that functional area. Horizontal placement usually distinguishes units at the same organizational level; it does not necessarily mean that one department has authority over another. The chart therefore communicates both hierarchy and departmental differentiation. It can also support analysis of span of control, levels of management, functional specialization, and possible communication paths between the top manager, department heads, and team leaders.
What a correct diagram must include
- A clear top-level position: Place the General Manager at the top so the highest formal authority is immediately identifiable.
- Distinct organizational units: Show Research and Development, Marketing, Production, and Finance as separate departments because each represents a different functional area.
- Subordinate teams: Add two teams under every department and align them beneath their parent department to make the hierarchy unambiguous.
- Standardized shapes: Use consistent boxes for positions or units; similar organizational levels should have similar size and visual treatment.
- Explicit reporting lines: Draw solid, direct connecting lines from each supervisor or department to its immediate subordinates.
- Accurate labels: Include complete position or unit names, avoiding unexplained abbreviations that may obscure responsibility.
- Consistent layout: Use balanced spacing and vertical alignment so viewers can compare departments and follow the structure without crossing lines.
Common mistakes
- Placing departments beside or above the General Manager without a clear connecting hierarchy, which incorrectly suggests equal or superior authority.
- Using one line to connect a department directly to all individual employees while omitting the intermediate teams, thereby hiding the intended chain of command.
- Treating horizontal alignment as a reporting relationship; units on the same level are usually peers unless an explicit line shows otherwise.
- Adding arrows, dotted lines, or decorative connectors without defining their meaning, which can confuse formal reporting with coordination or advisory relationships.
- Giving different departments inconsistent levels, box sizes, or naming formats, making equivalent positions appear unequal or structurally unrelated.
Teaching tips
Use the chart during an introductory lesson on organizational structure, management levels, or division of labor. Ask students to identify the highest authority, name each department’s immediate supervisor, and trace a reporting path from a team to the General Manager. Then ask why Research and Development, Marketing, Production, and Finance are separated by function, and whether horizontal peers can communicate directly. Connect the discussion to assessment points such as hierarchy, span of control, departmentalization, delegation, and formal versus informal relationships.
FAQ about this diagram
What does a vertical line in an organization chart usually mean?
A vertical connecting line normally represents a formal reporting relationship. The lower position or unit is accountable to the higher position, although the chart does not show every detail of daily supervision.
Are the four departments equal in authority?
They are generally shown as peer departments because they occupy the same horizontal level beneath the General Manager. Their functions differ, but the chart does not imply that one department controls another.
What is the difference between a department and a team in this chart?
A department is a broader functional unit responsible for an area such as Finance or Production. A team is a smaller subordinate unit within that department, usually responsible for a more specific task or work group.