Fishbone Diagram: Cause-and-Effect Analysis Generator
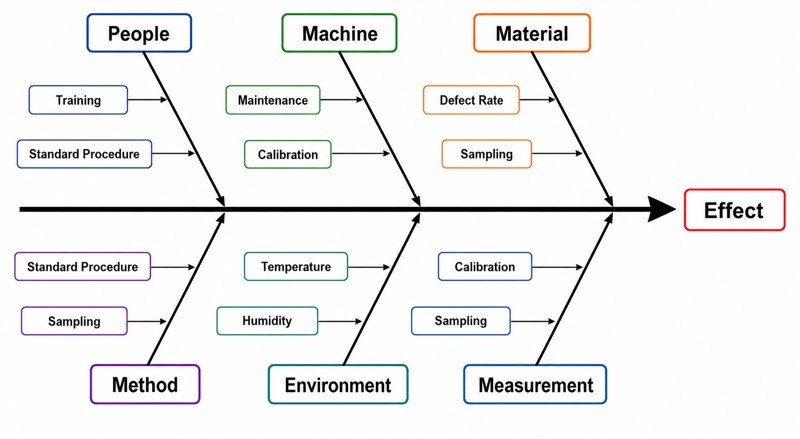
Free online Fishbone Diagram: Cause-and-Effect Analysis generator: get a fully labeled figure in about 90 seconds. The AI plans the must-have label list first, then renders a clean textbook-style diagram — every label editable afterwards, ready for papers, assignments and slides.
Labels included in this diagram
- Effect
- People
- Machine
- Material
- Method
- Environment
- Measurement
- Training
- Maintenance
- Defect Rate
- Standard Procedure
- Temperature
- Calibration
- Sampling
✓ Accurate labels ✓ Edit text after generation ✓ PNG for papers, posters & slides
 OUTPUT · 16:9 · PNG
What this diagram shows
An Ishikawa fishbone diagram, also called a cause-and-effect diagram, organizes possible causes of a defined problem or outcome. The problem is written at the fish head, while the central spine connects it to major cause categories. In the standard 6M framework, these categories are People, Machine, Material, Method, Environment, and Measurement. Smaller branches record specific conditions, actions, or failures that may contribute to each major category. The diagram is an analytical structure, not proof of causation: it helps a team generate, classify, and examine hypotheses before collecting evidence.
The reasoning moves from a clearly stated effect to increasingly specific possible causes. Major bones provide broad dimensions of analysis; secondary and tertiary bones decompose each dimension into observable factors. Causes should be phrased precisely enough to investigate, and overlapping factors should be placed where their main influence is clearest. After brainstorming, the team checks whether each proposed cause is logically connected to the effect, identifies interactions among causes, and verifies important hypotheses with data, observation, experiments, or process records.
What a correct diagram must include
- A clearly defined effect at the fish head: state the problem in specific, observable terms so the analysis has a fixed target.
- A horizontal central spine with a directional arrow: make the visual flow from contributing causes toward the identified effect unmistakable.
- Six major 6M bones—People, Machine, Material, Method, Environment, and Measurement: use them as broad prompts rather than forcing irrelevant causes into a category.
- Specific secondary and tertiary branches: break general labels into concrete conditions, behaviors, settings, or process steps that can be investigated.
- Consistent cause-to-effect relationships: draw each branch so it answers how that factor could contribute to the stated problem.
- Evidence-oriented wording: prefer testable statements such as 'uncalibrated scale' over vague labels such as 'equipment problems.'
- A review stage after brainstorming: mark, rank, or verify likely root causes instead of treating every branch as equally important.
Common mistakes
- Writing a vague effect such as 'poor quality' at the head, which makes the possible causes too broad to test.
- Listing symptoms, solutions, or opinions as causes without explaining the mechanism that links them to the effect.
- Treating the six 6M categories as a mandatory checklist and adding unrelated factors simply to fill every major bone.
- Stopping at broad labels such as 'training' or 'materials' instead of adding lower-level branches that identify the specific failure condition.
- Assuming that a cause appearing on the diagram is confirmed: a fishbone diagram generates hypotheses, while evidence is needed to establish a root cause.
Teaching tips
Use the diagram during problem definition, guided brainstorming, or process investigation. First ask students to state the effect in one measurable sentence; then assign groups one 6M category and require each proposed cause to answer, 'How could this produce the effect?' Have students distinguish causes from symptoms and solutions, then select two or three branches that require evidence. This supports assessment of cause-and-effect reasoning, classification, systems thinking, and the difference between hypothesis generation and causal verification.
FAQ about this diagram
What is the purpose of the six 6M categories?
They provide a systematic set of prompts for exploring different dimensions of a process. They reduce the risk of focusing only on people or equipment, but they do not prove that every category contains a relevant cause.
Should causes be written before or after the major bones?
Begin with the effect and the major categories, then add specific causes beneath each category. This broad-to-specific order keeps the analysis organized while allowing the team to revise categories when the process requires it.
Is the deepest branch automatically the root cause?
No. A deeply branched factor is only a more specific hypothesis. A root cause must be supported by evidence and should explain why the problem occurred and why removing or controlling that factor would reduce recurrence.