Bell Curve with Percentages and Z-Scores
Bell Curve with Percentages and Z-Scores — an alternative version of the Normal Distribution Bell Curve, generated by AI and fully editable. Download the PNG for quizzes, homework or slides.
Labels included in this diagram
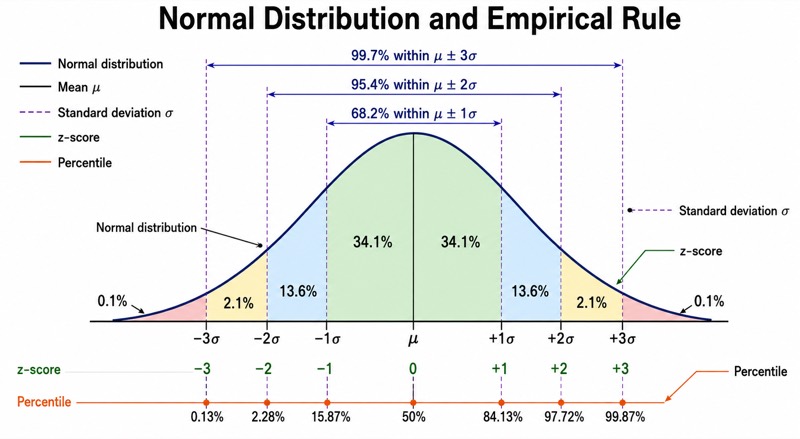
- Normal distribution
- Mean μ
- Standard deviation σ
- z-score
- Percentile
- 34.1%
- 13.6%
- 2.1%
- 0.1%
- 68.2% within μ ± 1σ
- 95.4% within μ ± 2σ
- 99.7% within μ ± 3σ
✓ Accurate labels ✓ Edit text after generation ✓ PNG for papers, posters & slides
 OUTPUT · 16:9 · PNG
What this diagram shows
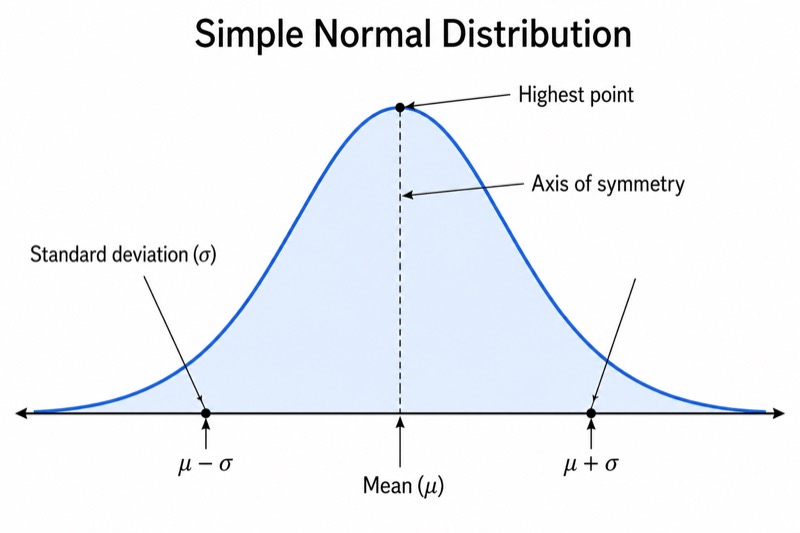
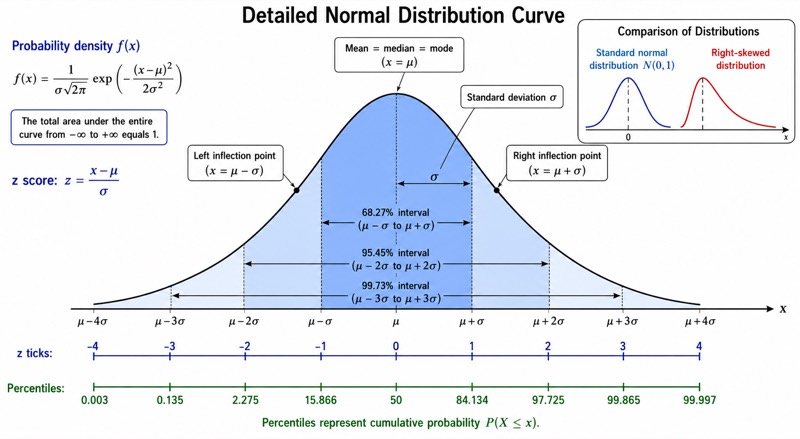
This bell curve with percentages and z-scores expands the standard normal-distribution diagram by adding quantitative labels. Instead of showing only a symmetric curve, the mean μ, and standard-deviation marks, it shades each interval from −3σ to +3σ and labels the approximate shares 34.1%, 13.6%, 2.1%, and 0.1%. Brackets above the curve show the cumulative 68.2%, 95.4%, and 99.7% ranges. A second scale connects z-scores from −3 to +3 with approximate percentile positions, making this version more useful for numerical interpretation than the standard main figure.
Read outward from μ, where z = 0 and the percentile is 50. A z-score states how many standard deviations a value lies above or below the mean; for example, z = +1 is near the 84th percentile, while z = −1 is near the 16th. Add the shaded interval percentages to estimate areas or probabilities, and use the brackets to apply the empirical rule quickly. Unlike the standard bell curve, this version directly links position, area, z-score, and percentile, so use it when students must calculate or interpret probability rather than merely recognize the distribution’s shape.
Teaching tips
- In-class quiz: display the diagram and ask students to identify the approximate percentage between μ and +2σ, the percentile associated with z = +1, or the probability of a value falling within two standard deviations of the mean.
- Homework: pair the figure with test-score or measurement data. Students can calculate z = (x − μ)/σ, locate the result on the axis, estimate its percentile, and explain which shaded regions represent the relevant probability.
- Presentation slide: use the layered brackets to introduce the 68–95–99.7 empirical rule, then contrast this percentage-and-z-score version with a standard main figure that shows shape and notation but not numerical areas.
- Review sheet or printed handout: include the diagram as a compact reference for interval percentages, z-score direction, percentile rank, μ, and σ. The center-to-tail color gradient helps students distinguish common observations from increasingly unusual ones.
- Paper or report illustration: use this specialized version when the discussion involves standardized scores, percentile standing, or approximate normal probabilities. Use the simpler standard bell curve instead when only symmetry, center, spread, or general distribution shape matters.
FAQ about this diagram
Why use this version instead of a standard bell curve?
A standard bell curve usually emphasizes symmetry, the mean, and spread, whereas this variant makes the numerical relationships explicit. It is preferable when readers need to connect standard-deviation intervals with percentages, z-scores, percentiles, and the empirical rule.
Are the percentages and percentile marks exact?
The 34.1%, 13.6%, 2.1%, and 0.1% labels are rounded empirical-rule values, so they support quick estimation rather than exact probability calculation. For precise results, use a standard normal table or cumulative distribution function; for reference, z = −2, −1, 0, +1, and +2 correspond approximately to the 2.3rd, 15.9th, 50th, 84.1st, and 97.7th percentiles.