Detailed ER Diagram (University Level)
Detailed ER Diagram (University Level) — an alternative version of the Entity-Relationship Diagram, generated by AI and fully editable. Download the PNG for quizzes, homework or slides.
Labels included in this diagram
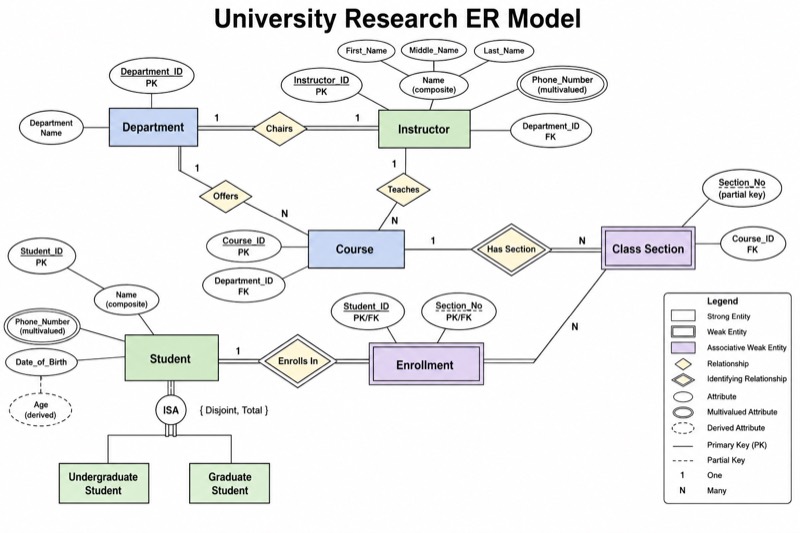
- Student (strong entity; Student_ID PK)
- Instructor (strong entity; Instructor_ID PK, Department_ID FK)
- Course (strong entity; Course_ID PK, Department_ID FK)
- Class Section (weak entity; Section_No partial key, Course_ID FK)
- Department (strong entity; Department_ID PK)
- Enrollment (associative weak entity; Student_ID PK/FK, Section_No PK/FK)
- Chairs
- Offers
- Has Section
- Teaches
- Enrolls In
- Name (composite: First_Name, Middle_Name, Last_Name)
- Phone_Number (multivalued) and Age (derived from Date_of_Birth)
- ISA: Undergraduate Student, Graduate Student
✓ Accurate labels ✓ Edit text after generation ✓ PNG for papers, posters & slides
 OUTPUT · 16:9 · PNG
What this diagram shows
This Detailed ER Diagram (University Level) extends the standard student-enrollment-course model into a six-entity academic and research schema: Student, Instructor, Course, Class, Department, and Enrollment. Unlike the standard overview, it identifies strong and weak entities, underlined primary keys, foreign keys, identifying relationships, composite attributes, multivalued attributes, and derived attributes. It also distinguishes 1:1, 1:N, and M:N cardinalities, total and partial participation, and an ISA generalization hierarchy. With more than twelve labeled structures, this version is intended for studying formal ER notation rather than merely recognizing entities and relationships.
Read rectangles as entities, ellipses as attributes, and diamonds as relationships; then follow each connector to inspect cardinality and participation constraints. Begin with primary and foreign keys, trace how Enrollment resolves the many-to-many association between Student and Class, and compare strong entities with the weak entity and its identifying relationship. Next, examine composite, multivalued, and derived attributes before interpreting the ISA hierarchy. This version should be used when the standard main diagram is too simplified to support schema analysis, normalization preparation, constraint checking, or discussion of how a conceptual university model will map to relational tables.
Teaching tips
- In-class quiz: hide selected labels and ask students to identify the weak entity, identifying relationship, key attributes, cardinalities, and total or partial participation constraints.
- Homework assignment: require students to convert the six-entity ER model into relational schemas, resolve the M:N relationship through Enrollment, and state the resulting primary-key and foreign-key constraints.
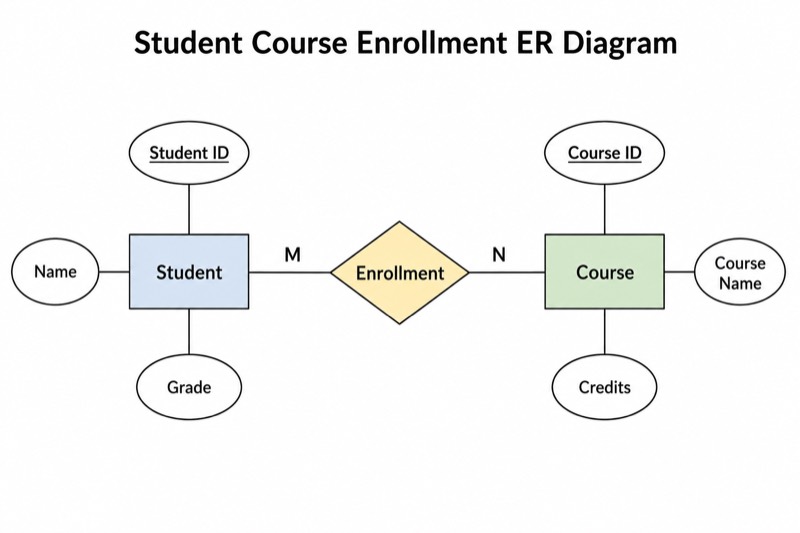
- Lecture slides: present the standard three-entity diagram first, then use this detailed version to explain why advanced modeling adds Department, Instructor, Class, weak-entity notation, attribute types, participation constraints, and ISA specialization.
- Review outline or printed handout: annotate each of the twelve-plus structures with its formal definition and use the uncrossed leader lines to compare 1:1, 1:N, and M:N relationships without visual ambiguity.
- Thesis or research-paper figure: use the diagram as a notation-rich reference when explaining a university data model, but adapt entity names, constraints, and ISA categories to match the actual research database.
FAQ about this diagram
Why use this detailed version instead of the standard ER diagram?
The standard diagram is best for introducing entities, attributes, relationships, and basic cardinality through Student, Enrollment, and Course. This university-level version is necessary when learners must analyze keys, weak entities, advanced attribute types, participation constraints, relationship degrees, and ISA hierarchies in one coherent model.
How should Enrollment and Class be interpreted in this model?
Course represents the catalog-level academic offering, while Class represents a particular scheduled instance, such as a section in a specific term. Enrollment acts as an associative entity between Student and Class, replacing their conceptual M:N relationship with two 1:N relationships and storing relationship-specific data such as enrollment date or grade.