Conceptual Framework Maker: A Practical Diagram Guide
A conceptual framework maker helps turn a research question into a visual model of variables and expected relationships. For graduate students writing a thesis, students completing research assignments, and teachers preparing methodology slides, the main challenge is rarely drawing the boxes. The difficult part is deciding what belongs in each box, where each variable should sit, and what every arrow is allowed to claim.
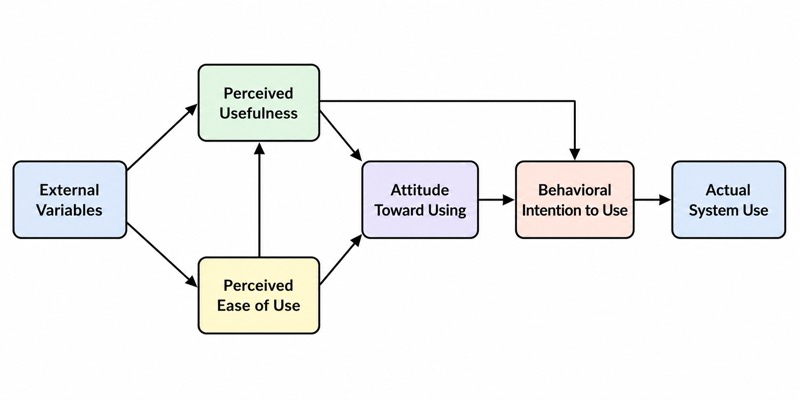
Conceptual framework diagrams usually use boxes to represent variables, one-way arrows to represent the hypothesized causal direction, and two-way arrows to represent correlational relationships. A mediator lies on the path between the independent variable and the dependent variable, while a moderator acts on the path itself. A theoretical framework comes from an existing theory, while a conceptual framework is the researcher's study-specific concretization.
This guide provides a practical workflow for building a defensible diagram rather than a decorative flowchart. It explains how to translate a research question into variables, position independent, dependent, mediating, moderating, and control variables, interpret different arrow arrangements, distinguish conceptual and theoretical frameworks, and check the finished figure for common logical and visual errors.
1. What a Conceptual Framework Maker Should Help You Do
A conceptual framework is a compact visual statement of what your study examines and how its main constructs are expected to relate. It is not a complete literature review, a project timeline, or a summary of every concept mentioned in the paper. A useful diagram allows a reader to identify the proposed predictors, outcomes, mechanisms, boundary conditions, and relevant controls within a few seconds.
Before opening a conceptual framework maker, write a one-sentence model statement. A reliable template is: “This study examines whether X influences Y, whether M explains that relationship, and whether W changes its strength or direction.” If you cannot complete that sentence clearly, drawing immediately will usually produce unnecessary boxes and ambiguous arrows.
Treat the diagram as a testable map. Each major arrow should correspond to a research question, hypothesis, or explicitly justified analytical relationship. If an arrow cannot be connected to the study design, literature review, or analysis plan, either remove it or explain why it is included.
- List the central outcome first; many unclear diagrams result from not defining what the study ultimately explains.
- Give every variable one consistent name across the figure, hypotheses, methods, tables, and results.
- Separate measured variables from broad background topics such as “technology,” “society,” or “education.”
- Use short labels in the boxes and define technical constructs in the caption or surrounding text.
2. Place Independent and Dependent Variables First
Begin with the simplest possible model: independent variable on the left and dependent variable on the right. The independent variable is the proposed predictor, exposure, intervention, or explanatory factor. The dependent variable is the outcome the study attempts to explain. In a study of whether feedback frequency affects student engagement, “feedback frequency” would normally appear on the left and “student engagement” on the right.
Draw a one-way arrow from the independent variable to the dependent variable only when it represents the hypothesized causal direction. The arrow communicates the direction of the hypothesis, not proof that causation has already been established. Whether a causal interpretation is justified depends on the research design, measurement quality, temporal ordering, confounding control, and analysis.
Studies may contain several predictors or outcomes. Place multiple independent variables in a vertical column on the left when they lead to the same outcome. Place multiple outcomes in a vertical column on the right when one predictor is expected to affect each of them. Avoid crossing arrows where possible; rearranging boxes is usually clearer than adding bends, colors, or decorative connectors.
- Write each construct as a noun phrase, such as “perceived usefulness,” rather than as a sentence.
- Keep the main reading direction consistent, usually left to right or top to bottom.
- Align variables with similar roles so readers can recognize the model structure without relying on color.
- If X and Y are only expected to covary, use a two-way arrow rather than implying a causal direction.
- Do not reverse an arrow merely because the alternative arrangement looks more balanced.
3. Position Mediators and Moderators Correctly
A mediator explains the process through which an independent variable is related to a dependent variable. Place it directly between the predictor and outcome, producing a path such as X → M → Y. For example, if training quality is expected to increase job performance by improving self-efficacy, self-efficacy is the mediator. The indirect path represents the proposed mechanism, while an additional X → Y arrow may be retained when the study also tests a direct effect.
A moderator answers a different question: when, for whom, or under what conditions does the X-to-Y relationship change? Because a moderator acts on the path itself, place its box above or below the relevant X → Y path and connect it to that path. For example, workload may change the strength of the relationship between managerial support and employee well-being. Pointing workload directly to well-being would instead depict workload as another predictor unless a separate direct effect is intentionally hypothesized.
Some studies contain moderated mediation, multiple mediators, or serial mediation. Build these diagrams incrementally. First draw the basic direct path, then add the mediator, and finally add the moderator to the exact path it is expected to modify. If the moderator affects the X → M path rather than the M → Y path, its connector must target that specific segment.
- Mediator: X → M → Y.
- Moderator: W points to or visibly qualifies a relationship path, such as X → Y.
- Parallel mediation: X leads to two or more mediators, each of which leads to Y.
- Serial mediation: X → M1 → M2 → Y.
- If software cannot attach a connector to another arrow, add a small label such as “moderated by W” beside the path and explain the notation in the caption.
- Do not call a variable a mediator merely because it appears physically in the middle; its theoretical role and analysis must support mediation.
4. Understand What Every Arrow Means
Arrow direction is part of the model's claim. A one-way arrow from X to Y represents a hypothesized causal direction from X toward Y. It does not mean the study has already demonstrated causation, and it should not be used simply to connect related ideas. A two-way arrow represents a correlational relationship in which the diagram does not specify a causal direction.
Multiple arrows entering one outcome indicate that several variables are proposed to explain that outcome. A chain of arrows indicates an ordered process. A direct X → Y arrow alongside X → M → Y separates the proposed direct relationship from the indirect pathway through the mediator. These patterns should match the hypotheses and planned statistical model.
Use line styles only when their meanings are necessary and explicitly defined. For example, a researcher might use solid lines for primary hypotheses and dashed lines for secondary or control paths, but such conventions are not universal. Add a legend or caption whenever line style, thickness, or color carries meaning. For journal-specific figure conventions, file formats, dimensions, and typography, 以官方指南为准.
- Check that every arrow has a clear source and destination.
- Do not draw arrows from a variable to an entire group of unrelated boxes without specifying the affected relationship.
- Avoid using arrow thickness to suggest effect size unless actual estimates are shown and the visual scale is explained.
- Do not use two opposing one-way arrows as a casual substitute for a two-way correlational arrow; they may imply two separate directional processes.
- If feedback loops are central to the study, explain their timing and logic rather than presenting a circular model without temporal information.
5. Conceptual Framework vs. Theoretical Framework
The distinction concerns where the framework comes from and how specifically it is applied. A theoretical framework comes from an existing theory, while a conceptual framework is the researcher's study-specific concretization. The theoretical framework identifies the established theoretical lens; the conceptual framework translates relevant concepts, findings, and assumptions into the particular variables and relationships investigated in the current study.
For example, a researcher may use an established motivation theory as the theoretical framework, then create a conceptual framework containing the study's chosen variables: teacher feedback, academic self-efficacy, study persistence, and course completion. The conceptual diagram does not need to reproduce every construct in the original theory. It should show the subset and arrangement that the research questions, population, context, and measurements actually address.
The two frameworks can coexist in the same paper. The theoretical framework section can explain the theory's origin, propositions, and relevance, while the conceptual framework section can justify the study-specific model and diagram. Do not rename a collection of variables as a “theory” merely because arrows connect them; theoretical status requires an established explanatory system and appropriate scholarly support.
- Use the theoretical framework to answer: Which existing theory guides the study?
- Use the conceptual framework to answer: What exactly will this study examine?
- Cite the original or authoritative theoretical sources when discussing an established theory.
- Support each proposed conceptual relationship with relevant evidence or reasoning.
- Explain adaptations when your diagram changes, combines, or narrows constructs from prior models.
6. Build the Diagram in a Conceptual Framework Maker
A practical workflow begins outside the canvas. Review the research question, hypotheses, operational definitions, and planned analysis, then create a variable inventory. Classify each item as independent, dependent, mediating, moderating, control, or contextual. This prevents the common mistake of assigning roles according to box position after the diagram has already been drawn.
Next, create a rough version using plain boxes and monochrome arrows. Start with X and Y, add mediators, add moderators to the relevant paths, and place control variables last. Only after the logic is correct should you adjust alignment, typography, spacing, line weight, or color. A visually polished model with incorrect causal logic is less useful than a plain but accurate one.
Before exporting from a conceptual framework maker, inspect the figure at the size at which readers will encounter it. Labels that look clear on a large editing canvas may become unreadable in a thesis page, article column, classroom handout, or presentation slide. Export in the format required by the submission or teaching context; for specific resolution, dimensions, accepted file types, or accessibility requirements, 以官方指南为准.
- Step 1: Write the main research question in one sentence.
- Step 2: Extract the constructs and remove terms that are merely population or setting descriptions.
- Step 3: Assign one research role to each construct for each tested relationship.
- Step 4: Draw the simplest direct model before adding complexity.
- Step 5: Match each arrow to a hypothesis or stated analytical path.
- Step 6: Add a caption defining abbreviations, line styles, and unusual notation.
- Step 7: Ask another reader to explain the model without seeing your written hypotheses; revise anything they misinterpret.
7. Common Conceptual Framework Errors and How to Fix Them
The most frequent logical error is treating every variable as a direct cause of every other variable. This creates a dense web of arrows that is difficult to interpret and often unsupported by the research questions. Fix it by drawing only the relationships the study will justify and evaluate. Background characteristics can be placed in a separate control-variable area rather than connected indiscriminately to the whole model.
Another error is confusing a moderator with a mediator. A mediator belongs on the pathway between X and Y because it explains how the relationship occurs. A moderator acts on the pathway because it changes the relationship under different conditions. If the diagram shows W as X → W → Y, readers will interpret W as a mediator even if the text calls it a moderator.
Visual inconsistency also creates conceptual ambiguity. If rectangles represent variables in one part of the figure but represent theories or populations elsewhere, readers cannot infer the notation. Use a limited shape vocabulary, consistent capitalization, even spacing, and a defined reading direction. Color should reinforce structure, not carry information that disappears in grayscale or becomes inaccessible to readers with color-vision differences.
Finally, avoid including variables that are absent from the methods. If a construct appears in the framework, readers will reasonably expect it to be defined, measured or otherwise examined, and addressed in the analysis. Conduct a final cross-check among the diagram, research questions, hypotheses, instrument or data source, and analysis plan.
- Error: arrows point both ways even though the text proposes a directional hypothesis. Fix: choose the notation that matches the claim.
- Error: the diagram contains long definitions inside boxes. Fix: shorten labels and move definitions to the text or caption.
- Error: the model uses unexplained dashed lines or colors. Fix: add a legend or remove unnecessary styling.
- Error: control variables dominate the layout. Fix: group them in a secondary area and connect them only where analytically relevant.
- Error: the same construct has different names in different chapters. Fix: create a terminology checklist before submission.
- Error: a theory name is placed as if it were a measured variable. Fix: discuss the theory as the foundation and show its study-specific constructs in the conceptual model.
FAQ about this diagram
How do I make a conceptual framework for my research?
Start by identifying the main outcome, then list the variables expected to explain it. Classify each variable as independent, dependent, mediating, moderating, or control, and draw only the relationships supported by your research questions and literature. Check that every arrow corresponds to a hypothesis or planned analytical path.
Where should a moderator go in a conceptual framework diagram?
Place the moderator above or below the relationship it is expected to change, with a connector pointing to that path. If it changes the X → Y relationship, it should act on that arrow rather than simply appear between X and Y. Explain the notation in the caption if the visual connection could be misunderstood.
Can a conceptual framework have more than one dependent variable?
Yes, a model can contain multiple dependent variables when the research questions and analysis address each outcome. Arrange the outcomes clearly, show which predictors connect to each one, and avoid implying relationships that are not tested. If the diagram becomes crowded, divide it into labeled panels while preserving the same underlying logic.
What is the difference between a conceptual framework and a theoretical framework?
A theoretical framework comes from an existing theory and provides an established explanatory lens. A conceptual framework is the researcher's specific model for the current study, showing the selected variables and proposed relationships. A paper may use both, with the theory justifying the study-specific conceptual diagram.