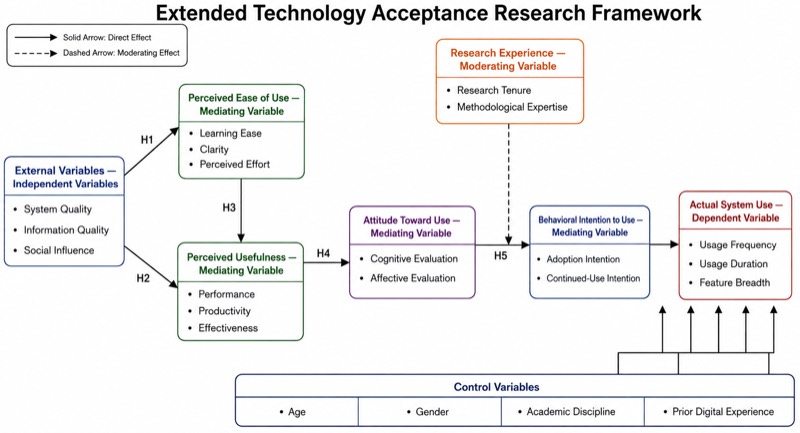
Detailed Conceptual Framework Diagram (University Level)
Detailed Conceptual Framework Diagram (University Level) — an alternative version of the Conceptual Framework: Technology Acceptance Model, generated by AI and fully editable. Download the PNG for quizzes, homework or slides.
Labels included in this diagram
- External Variables — Independent Variables (System Quality; Information Quality; Social Influence)
- Perceived Ease of Use — Mediating Variable (Learning Ease; Clarity; Perceived Effort)
- Perceived Usefulness — Mediating Variable (Performance; Productivity; Effectiveness)
- Attitude Toward Use — Mediating Variable (Cognitive Evaluation; Affective Evaluation)
- Behavioral Intention to Use — Mediating Variable (Adoption Intention; Continued-Use Intention)
- Actual System Use — Dependent Variable (Usage Frequency; Usage Duration; Feature Breadth)
- Research Experience — Moderating Variable (Research Tenure; Methodological Expertise)
- Control Variables (Age; Gender; Academic Discipline; Prior Digital Experience)
- H1: External Variables -> Perceived Ease of Use
- H2: External Variables -> Perceived Usefulness
- H3: Perceived Ease of Use -> Perceived Usefulness
- H4: Perceived Usefulness -> Attitude Toward Use
- H5: Attitude Toward Use -> Behavioral Intention to Use
- Solid Arrow: Direct Effect; Dashed Arrow: Moderating Effect
✓ Accurate labels ✓ Edit text after generation ✓ PNG for papers, posters & slides
 OUTPUT · 16:9 · PNG
What this diagram shows
This Detailed Conceptual Framework Diagram (University Level) expands the standard Technology Acceptance Model beyond its six familiar components: external variables, perceived usefulness, perceived ease of use, attitude toward use, behavioral intention, and actual use. It adds system quality, information quality, social influence, facilitating conditions, digital literacy, trust, perceived risk, and demographic controls. Unlike the standard main diagram, which introduces TAM through a small set of causal arrows, this version distinguishes independent, mediating, moderating, control, and dependent variables. Use it when students must move from recognizing a theory to specifying a researchable model.
Read the solid arrows as proposed direct effects and the dashed arrows as moderation paths. Hypotheses H1–H5 identify testable relationships, while construct labels indicate measurement dimensions such as usefulness for performance, ease of learning, attitudinal evaluation, intention frequency, and observed usage. Mediators explain how an external factor influences adoption; moderators indicate when or for whom an effect changes. Control variables are grouped at the bottom to separate background influences from the focal theory. This version is preferable to the standard main diagram for operationalization, hypothesis development, survey design, and statistical analysis, but not for a brief first introduction to TAM.
Teaching tips
- In-class quiz: remove the labels for mediator, moderator, and dependent variable, then ask students to classify the constructs and explain why a dashed moderation path is interpreted differently from a solid direct-effect arrow.
- Homework assignment: require students to rewrite H1–H5 as directional statements, identify the predictor and outcome in each hypothesis, and propose one measurable indicator for every major construct.
- Lecture slides and review outlines: present the standard TAM diagram first, then use this detailed version to demonstrate how a parsimonious theoretical model becomes a university-level empirical framework with added boundary conditions and controls.
- Thesis or research-paper figure: adapt the constructs to the study context, retain only theoretically justified paths, define each measurement dimension in the methods section, and ensure that every displayed hypothesis corresponds to a planned statistical test.
- Printed handout: pair the diagram with a table listing construct definitions, scale sources, sample items, and variable roles; students can trace H1–H5 without crossing leader lines and annotate direct, indirect, and conditional effects.
FAQ about this diagram
Why use this detailed version instead of the standard TAM main diagram?
The standard diagram is best for learning the core adoption sequence, whereas this version supports research design by separating variable roles, measurement dimensions, hypotheses, and controls. Use the detailed version when the task requires operationalization or empirical testing rather than simple theory recognition.
Do all 12 or more constructs need to appear in an actual study?
No. Constructs should be retained only when theory, prior evidence, and the research question justify them; unnecessary variables reduce parsimony and may create identification or multicollinearity problems. The expanded diagram is a planning template, not a requirement to estimate every possible relationship.