PRISMA flow diagram generator: 2020 Box Guide
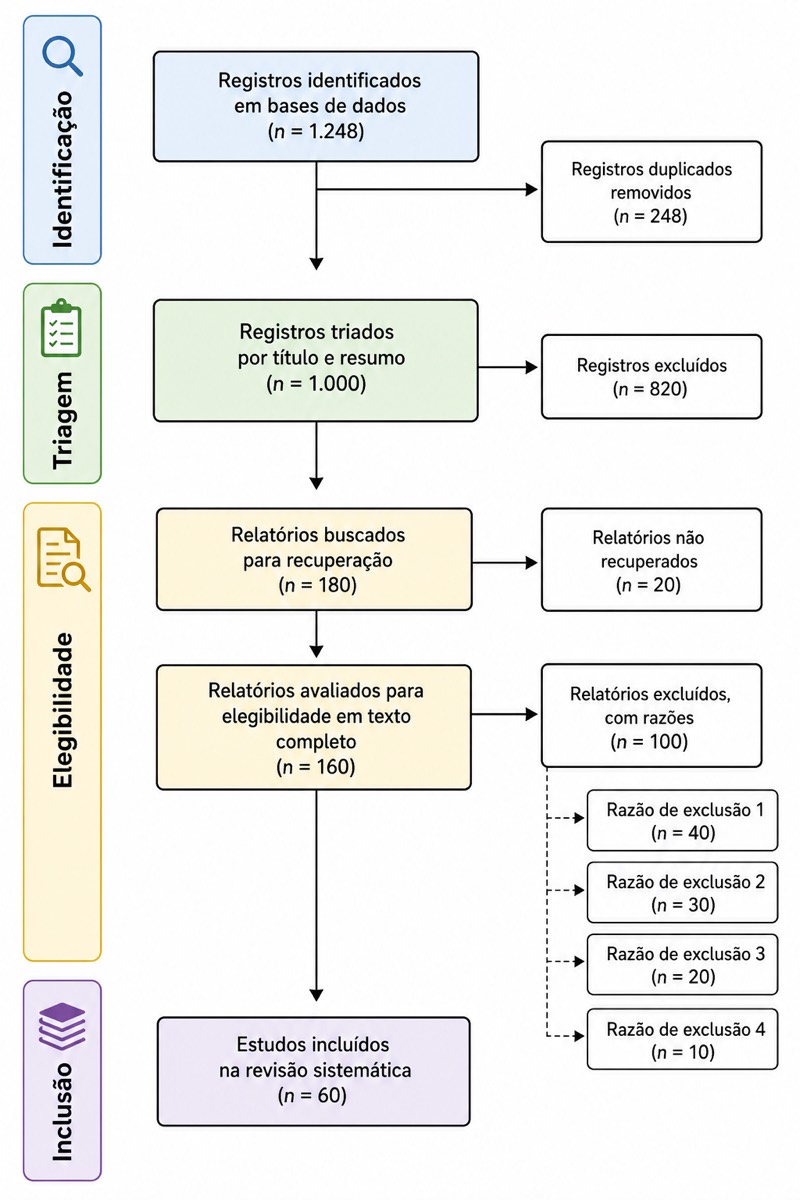
A PRISMA flow diagram generator turns your literature-search log into a visual account of how evidence moved through a systematic review. The diagram records the changing numbers of references from identification through screening and eligibility assessment to final inclusion. At each relevant step, you report how many items remained, how many were excluded, and why exclusions occurred. For graduate students writing a thesis, students completing a review assignment, and teachers preparing research-methods slides, the difficult part is rarely drawing the boxes. It is deciding which number belongs in each box and making the arithmetic auditable.
The PRISMA 2020 statement replaced the 2009 version. One important change is that the 2020 flow diagram separates records found through databases and registers from records found through other methods, such as citation searching. It also encourages clearer reporting of pre-screening removals, retrieval failures, full-text decisions, included studies, and reports describing those studies.
This guide explains the diagram box by box, using a consistent numerical example. The numbers are illustrative rather than targets: a real review may identify dozens or tens of thousands of records. Record your actual results, retain an audit trail, and use the template appropriate to your review. Where a course, institution, journal, or updated template imposes a specific convention, 以官方指南为准 (follow the official guidance).
1. Prepare the numbers before using a PRISMA flow diagram generator
Before entering anything, distinguish three units that are often confused. A record is an entry in a database, register, reference manager, or screening system, usually containing a title and abstract. A report is a document that can be retrieved and assessed, such as a journal article, conference paper, thesis, or report. A study is the underlying investigation. One study may have several reports, and one report may describe more than one study.
Create a source log and a decision log before drawing the diagram. For every search source, record the source name, search date, number exported, and any export limitations. During deduplication and screening, preserve counts for duplicates, automated removals, other pre-screening removals, title-and-abstract exclusions, reports not retrieved, and reports excluded after eligibility assessment. Do not try to reconstruct these numbers from memory at the end of the project.
Use a reconciliation sheet with one row for every box in the intended diagram. Add formulas so that the remaining count at one step equals the starting count minus documented removals. A generator can format valid data, but it cannot repair missing decisions, mixed counting units, or unexplained arithmetic gaps.
- Create permanent IDs for imported records so decisions can be traced after deduplication.
- Keep raw exports unchanged and perform cleaning in copies or in a versioned review library.
- Record database and register results separately from results found through websites, organisations, citation searching, or other methods.
- Decide who resolves screening disagreements and preserve the final agreed decision rather than counting both reviewers’ votes.
- Label every number as records, reports, or studies in your working sheet.
2. Identification: enter database, register, and other-source results
The identification stage begins with what each search method produced, before ordinary title-and-abstract screening. In the database and register pathway, report the number identified from databases and the number identified from registers. If several databases were searched, your supporting search log should retain each source-level count even if the displayed box uses an aggregated total.
PRISMA 2020 distinguishes the database/register pathway from a parallel pathway for other methods. Other methods can include websites, organisations, citation searching, and comparable approaches. Do not quietly add these results to a database total. Enter them in the appropriate parallel path so readers can see how much each family of methods contributed.
Suppose databases produced 1,240 records and registers produced 60. The database/register identification total is therefore 1,300. Separately, assume citation searching and other methods found 45 items. Keep the 45 visible in the other-methods path instead of reporting a single unexplained total of 1,345.
Next, document removals made before screening. In the example, 210 duplicate records, 20 records marked ineligible by automation tools, and 5 records removed for other documented reasons leave 1,065 database/register records to screen: 1,300 − 210 − 20 − 5 = 1,065. Only use the automation category if a tool actually made or implemented an eligibility-related removal; software used merely to display or prioritise records is not automatically an exclusion tool.
- Databases identified: 1,240 illustrative records.
- Registers identified: 60 illustrative records.
- Duplicates removed before screening: 210.
- Marked ineligible by automation tools: 20, only if that process occurred.
- Removed for other documented reasons: 5.
- Records entering database/register screening: 1,065.
- Other-method results: 45, retained in their separate pathway.
3. Screening: reconcile titles and abstracts without double counting
Screening normally refers to applying the initial eligibility criteria to titles, abstracts, or equivalent record-level information. For the database/register branch, the number of records screened should equal the identified records minus all removals made before screening. In the example, that is 1,065. It is not 1,300, because the 235 pre-screening removals never reached ordinary screening.
Report the number of records excluded during screening. If 850 of the 1,065 records are excluded, 215 proceed toward retrieval: 1,065 − 850 = 215. The flow diagram generally needs the total excluded at this stage rather than a long list of title-and-abstract exclusion reasons. Detailed screening codes may still be valuable internally, especially for training reviewers or explaining the method in an appendix.
Count records, not reviewer actions. If two reviewers independently screen the same 1,065 records, the diagram still shows 1,065 records screened, not 2,130 screening decisions. Likewise, a disagreement resolved by a third reviewer remains one record. The final status of the record is what moves through the diagram.
Be consistent about records discovered through other methods. Keep them in the route designated by the official PRISMA 2020 template being used, preserve their source labels, and document any overlap with items already identified. If the exact treatment of a special source is uncertain, 以官方指南为准 (follow the official guidance) rather than inventing a new box or silently merging categories.
- Check: 1,300 identified − 235 removed before screening = 1,065 screened.
- Check: 1,065 screened − 850 excluded = 215 reports sought for retrieval.
- Do not multiply counts by the number of reviewers.
- Do not count a duplicate again as a screening exclusion.
- Use internal screening codes if useful, but avoid forcing vague or unreliable reasons into the displayed diagram.
4. Eligibility: retrieval, full-text review, and exclusion reasons
After initial screening, the terminology changes from records to reports because reviewers now seek retrievable documents. Enter the number of reports sought for retrieval, followed by the number not retrieved. If 215 reports are sought and 7 cannot be obtained after the review’s documented retrieval process, then 208 reports are assessed for eligibility: 215 − 7 = 208.
A report not retrieved is not the same as a report excluded after eligibility assessment. The first could not be assessed because the document was unavailable. The second was read or otherwise assessed and failed one or more predefined criteria. Keeping these categories separate prevents an unavailable paper from being presented as if its population, design, intervention, or other characteristics had been evaluated.
For reports assessed in full, give exclusion reasons that map directly to the eligibility criteria. Prefer specific labels such as ineligible population, ineligible study design, ineligible intervention, or duplicate report of an already counted study. Avoid labels such as irrelevant, unsuitable, failed criteria, or not useful because readers cannot tell what rule was applied.
Assign one primary exclusion reason to each excluded report when producing mutually exclusive diagram totals. A paper may fail several criteria, but counting it under every failed criterion inflates the total. Establish a reason hierarchy before full-text assessment—for example, publication type first, then population, design, intervention, comparator, and outcome—and apply it consistently. The hierarchy should reflect the review protocol rather than this illustrative order.
- Reports sought for retrieval: 215.
- Reports not retrieved: 7.
- Reports assessed for eligibility: 208.
- Illustrative exclusions: ineligible population 52; ineligible design 41; ineligible intervention 28; duplicate or companion report handled as ineligible for separate inclusion 12; insufficient eligible data under a predefined criterion 17.
- Arithmetic check: 52 + 41 + 28 + 12 + 17 = 150 excluded reports.
- Eligible reports remaining from this branch: 208 − 150 = 58.
5. Included: report studies and reports as different units
The final stage must not collapse reports and studies into one ambiguous number. Reports are documents; studies are the underlying investigations. If two articles describe different follow-up periods from the same trial, they may represent two included reports but one included study. Conversely, a single report can sometimes contain results from more than one distinct study.
Continue the example by assuming the database/register branch yields 58 eligible reports. The other-methods pathway might yield another 12 eligible reports after retrieval and eligibility assessment, producing 70 included reports overall. After linking companion publications and identifying the underlying investigations, those 70 reports might represent 64 studies. The diagram would therefore show 64 included studies and 70 reports of included studies.
Do not deduplicate at the study level by deleting useful companion reports. Link all related reports to the same study ID and retain whichever reports contribute eligible information. The final study count should come from this linkage process, not from guessing that every full-text article equals one study.
Also distinguish inclusion in the systematic review from inclusion in a particular synthesis. A study can satisfy the review eligibility criteria yet be absent from a meta-analysis because its outcome measure, time point, or statistical information cannot be combined. Do not remove such a study from the review-level included box merely to make the flow diagram match the meta-analysis count.
- Give each included study a study ID and each document a separate report ID.
- Create a study-to-report table before finalising the last boxes.
- Check whether conference abstracts and later full articles describe the same study.
- Report review inclusion separately from inclusion in individual quantitative syntheses.
- Do not assume that the number of studies must equal the number of reports.
6. PRISMA 2020 versus 2009: what changed in the workflow
The PRISMA 2020 statement replaced the 2009 version. The central purpose remains recognisable: showing how evidence moved from identification through screening and eligibility assessment to inclusion. However, copying a familiar 2009-style diagram and changing the year is not enough to capture the more detailed accounting expected by the 2020 framework.
A major visible difference is the separation of databases and registers from other identification methods, including citation searching. This parallel presentation helps readers understand whether evidence came from structured electronic searches or supplementary discovery methods. It also makes the contribution of other methods visible instead of burying them in a combined identification total.
The 2020 presentation provides more explicit places to account for records removed before screening, including duplicates, records marked ineligible by automation tools, and records removed for other reasons. It also makes retrieval and report-level eligibility decisions clearer and distinguishes included studies from reports of included studies. These distinctions reduce the temptation to use one unit for every box.
When converting an older diagram, return to the underlying logs rather than distributing old totals among new boxes by estimation. If the original project did not record automation removals, retrieval failures, or source-specific results, say what can be supported and avoid invented precision. For the exact template appropriate to a new or updated review and for any current reporting rules, 以官方指南为准 (follow the official guidance).
- Do not merely relabel a 2009 diagram as PRISMA 2020.
- Separate database/register identification from other methods.
- Account explicitly for removals before screening.
- Separate reports sought, reports not retrieved, and reports assessed.
- Distinguish included studies from reports of included studies.
- Reconstruct only numbers supported by the review records.
7. Audit a PRISMA flow diagram generator output before submission
A PRISMA flow diagram generator is most useful as the final layer of a controlled workflow. Enter reconciled values from your tracking sheet, generate the visual, and then audit every arrow. Starting at the top, recalculate each subtraction and confirm that the destination number is expressed in the correct unit. Repeat the audit independently for the database/register and other-method pathways before checking the combined included totals.
The most common error is an unexplained gap: identified records minus duplicates does not equal screened records, or reports sought minus reports not retrieved does not equal reports assessed. Other frequent problems include putting duplicates under screening exclusions, counting reviewer votes instead of unique records, treating all full texts as separate studies, and allowing exclusion-reason totals to exceed the number of excluded reports.
Check language as carefully as arithmetic. Exclusion reasons should reflect protocol criteria, use parallel wording, and be understandable without access to private reviewer notes. Replace not relevant with a criterion-based reason. Replace wrong article with ineligible publication or report type if that was genuinely an eligibility criterion. Do not create a retrospective criterion simply to explain an inconvenient exclusion.
Finally, compare the diagram with the methods, results, abstract, appendices, and search documentation. A diagram showing 64 included studies conflicts with a results section describing 66 unless the text clearly concerns a different synthesis or subset. Export a legible version, keep an editable source, and record the date on which the counts were frozen so later search updates do not produce undocumented inconsistencies.
- Confirm that every box has a label, unit, and integer count.
- Recalculate every subtraction instead of trusting visual alignment.
- Ensure full-text exclusion reasons sum exactly to excluded reports when categories are mutually exclusive.
- Verify that reports not retrieved are not also counted as eligibility exclusions.
- Cross-check included studies and included reports against the study-to-report table.
- Compare diagram totals with the abstract, methods, results, appendices, and search log.
- Have a second person perform a final arithmetic and terminology audit.
Perguntas sobre este diagrama
What numbers do I put in a PRISMA 2020 flow diagram?
Start with results identified from databases, registers, and other methods. Then enter pre-screening removals, records screened and excluded, reports sought and not retrieved, reports assessed and excluded with reasons, and the final numbers of included studies and reports. Each transition should reconcile mathematically.
Do PRISMA exclusion reasons have to add up to the full-text exclusions?
Yes, when the displayed reasons are mutually exclusive primary reasons, their counts should sum to the total number of reports excluded after eligibility assessment. If one report failed several criteria, assign one primary reason according to a predefined hierarchy rather than counting it repeatedly.
Are duplicates included in records excluded during screening?
No. Duplicates removed before title-and-abstract screening belong in the pre-screening removal area, not in the screened-and-excluded count. Removing them twice will create an arithmetic gap and understate the number that should proceed.
Why are included studies and included reports different in PRISMA 2020?
A study is the underlying investigation, while a report is a document describing it. One study may produce several articles, abstracts, or follow-up reports, so the report total can differ from the study total. Link reports to study IDs before completing the final boxes.