Neural Network Architecture Diagram: A Paper Guide
A good neural network architecture diagram should let a reader understand the model’s data flow, major operations, tensor transformations, and repeated structures before reading the implementation details. For graduate students preparing papers, students completing assignments, and teachers building slides, the challenge is not simply drawing every layer. It is deciding what to show, what to compress, and how to establish a visual grammar that remains readable at the final publication or presentation size.
This guide explains how to represent convolution, pooling, fully connected layers, attention, residual paths, and tensor dimensions. It also compares CNN and Transformer layouts and evaluates three practical production routes: code-based generation, manual drawing, and AI-assisted generation. There is no single universal visual standard, so always check venue-specific formatting, file type, and accessibility requirements; for uncertain journal or conference rules, 以官方指南为准。
1. Plan the information before drawing the architecture
Begin by writing a one-line description of the figure’s purpose. A model overview might answer, “How do inputs become predictions?” A module figure might answer, “What happens inside the proposed attention block?” A training-system figure may need to show multiple networks, losses, or data branches. If one figure tries to answer all three questions, it will usually become too dense for a paper column or lecture slide.
Next, list the operations in forward order and record the tensor shape after each important transition. Group routine operations that do not need individual boxes. For example, a repeated convolution–normalization–activation sequence can become one labeled block, provided the caption or legend explains the abbreviation. Preserve individual operations when their order is scientifically important, when they define the contribution, or when changing that order would produce a different model.
Choose a reading direction before arranging elements. Left-to-right works well for sequential pipelines and wide paper figures, while top-to-bottom may fit narrow columns. Branches should leave the main path at visible junctions and rejoin at explicit merge symbols. Arrow direction represents forward propagation, so avoid decorative arrows that do not correspond to a real computational or information-flow relationship.
- Write the input, major stages, outputs, and losses as a plain-text sequence first.
- Mark repeated stages and decide whether to expand one example or compress all repetitions.
- Identify the model’s novel component and give it more visual detail than standard components.
- Prepare both a detailed master figure and a simplified version if the paper and slides have different needs.
2. Choose a visual grammar for the neural network architecture diagram
A consistent symbol system matters more than elaborate artwork. Boxes are the most flexible option because they support readable labels such as “3×3 Conv,” “Max Pool,” “LayerNorm,” or “Cross-Attention.” Three-dimensional cuboids are useful when spatial feature maps are central to the explanation. Circles or vertical columns of dots are commonly used for neurons in fully connected layers, especially in teaching diagrams and compact multilayer perceptron illustrations.
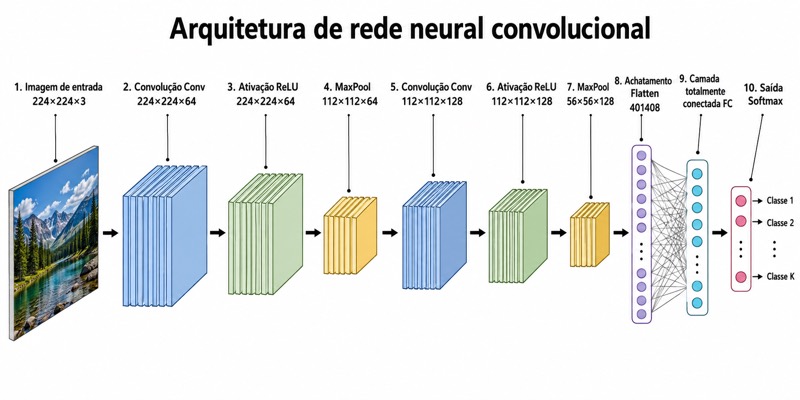
For CNNs, feature maps are commonly drawn as three-dimensional rectangular cuboids and labeled with channels×height×width, such as 64×56×56, or with H×W×C. Pick one dimension order and use it throughout the neural network architecture diagram. If the implementation uses another internal memory layout, the figure can still use a reader-friendly order, but the order must be stated in the legend or caption.
Do not use one shape to mean several unrelated things. If a rounded rectangle represents an operation, it should not also represent a tensor unless the difference is made obvious through borders, fills, or labels. Create a small legend whenever the diagram contains specialized symbols. A legend is particularly valuable when dashed arrows indicate skip paths, dotted outlines indicate repeated blocks, or stacked cuboids indicate multiple channels.
- Use boxes for named operations or modules.
- Use cuboids for spatial tensors and feature maps.
- Use dot columns selectively for fully connected layers rather than for large modern networks.
- Use diamonds, circles, or labeled nodes for concatenation, addition, gating, and other merge operations.
- Keep arrowheads, border styles, corner radii, and symbol meanings consistent.
3. Draw convolution, pooling, dense layers, and attention clearly
Represent a convolution as either a labeled operation box between two feature-map cuboids or as a compact block that combines the operation and its output. Include kernel size, stride, padding, groups, or dilation only when they help the reader understand a shape change or a methodological choice. A label such as “Conv 3×3, s=2” is usually more useful than a box filled with every implementation parameter. If several identical convolutions repeat, show a multiplication marker such as “×N” and define N in the figure or caption.
Pooling is usually shown as a narrowing spatial transition or a labeled “Max Pool,” “Avg Pool,” or “Global Average Pool” box. Do not imply that channels shrink merely because height and width shrink; label the output tensor. Fully connected layers are conventionally drawn as columns of dots, but a box labeled “Linear,” “FC,” or “MLP” is often clearer when the network has hundreds or thousands of units. Use the dot-column style when the number and connectivity pattern are conceptually important, not as an attempt to draw every real neuron.
Attention needs a different visual vocabulary. Show the input sequence or feature tensor entering an attention block, then make any residual route and merge point visible. Query, key, and value branches may be displayed when they are relevant to the explanation; otherwise, a single “Multi-Head Attention” box prevents unnecessary clutter. Feed-forward or MLP blocks should be distinct from attention blocks, and normalization placement must match the actual implementation. A pre-normalization design should not be illustrated as post-normalization merely because the latter creates a tidier layout.
- Convolution: show the operation and the resulting feature-map shape.
- Pooling: emphasize the affected spatial dimensions.
- Fully connected layer: use dot columns for pedagogy or a labeled box for compactness.
- Attention: expose Q, K, and V only when those paths matter to the argument.
- Residual addition: use an explicit merge node such as “+” instead of letting lines overlap ambiguously.
4. Label tensor dimensions without turning the figure into a table
Dimension labels should appear at meaningful changes rather than on every arrow. Always consider labeling the input, the output, the first latent representation, each resolution change, each channel-width change, and the boundaries around a proposed module. In a CNN, a sequence might move from 64×56×56 to 128×28×28 after downsampling. This makes both the channel increase and spatial reduction visible without requiring the reader to infer them from the cuboid proportions.
Define the dimension order once. For example, write “tensor labels use C×H×W” in the legend, or use H×W×C consistently if that better matches the intended audience. For batched data, omit the batch dimension when it is not informative, or label it symbolically as B. Sequence models often benefit from labels such as B×L×D, where the legend explains batch size, sequence length, and embedding dimension. Keep symbolic dimensions when input lengths vary instead of inventing fixed numerical examples.
Place shape labels near outputs rather than inside small operation boxes. A practical hierarchy is to put the layer or module name inside the box, key hyperparameters below it, and the tensor shape beside or beneath the outgoing edge. Avoid mixing notation such as C×H×W in one stage and W×H×C in another. If concatenation or addition occurs, label the dimensions before and after the merge so readers can verify that the operation is structurally valid.
- Label dimensions after downsampling, upsampling, concatenation, flattening, and projection.
- Use multiplication signs consistently; do not alternate unpredictably between “×,” “x,” and commas.
- State whether a sequence shape is B×L×D, L×B×D, or another order.
- Use symbolic labels for dynamic dimensions and numerical labels for fixed architecture settings.
- Cross-check every displayed shape against a real forward pass or model summary.
5. CNN vs Transformer neural network architecture diagram patterns
A CNN diagram usually emphasizes spatial resolution and channel depth. Its visual rhythm comes from feature-map cuboids that become spatially smaller and often deeper as data moves through convolution and pooling stages. Encoder–decoder CNNs may form a U-shaped layout, with skip connections linking matching resolutions. Because cuboid size is partly symbolic, label the dimensions explicitly rather than expecting geometric proportions to carry exact quantitative meaning.
The classic paradigm for Transformer structure diagrams comes from Vaswani et al.’s 2017 paper “Attention Is All You Need.” Transformer diagrams typically emphasize repeated blocks, attention, feed-forward sublayers, normalization, residual connections, positional information, and sequence flow. Unlike CNN figures, they rarely need progressively shrinking spatial cuboids. Repetition and residual topology are usually more important than simulated three-dimensional depth.
Do not copy an encoder–decoder Transformer layout if the model is encoder-only, decoder-only, multimodal, or otherwise structurally different. Show only the stacks that exist in the actual model. For repeated layers, draw one expanded block and place “×N” next to the stack, then provide N where appropriate. If cross-attention is present, make the source of keys and values visually distinct from the query path. If it is absent, do not include it merely because it appears in a familiar Transformer template.
- CNN focus: channel count, spatial size, downsampling, receptive-field stages, and skip connections.
- Transformer focus: sequence representations, repeated blocks, attention, MLPs, residual paths, and normalization.
- CNN tensors often use C×H×W or H×W×C; sequence diagrams can use symbolic sequence and embedding dimensions.
- Expand the proposed or modified block; compress standard repeated blocks.
- Use separate visual lanes for multimodal inputs or encoder-to-decoder information flow.
6. Set color, typography, spacing, and export quality
Use color to encode categories, not to decorate individual layers. A compact palette might assign one color to convolutional or feature-extraction stages, another to downsampling, another to attention, and a neutral color to normalization or utility operations. Four to six functional colors are usually enough for a complex model. Also vary labels, borders, or patterns so that the figure remains understandable in grayscale and for readers with color-vision deficiencies.
Design at the final display size whenever possible. As a practical starting point rather than a publication rule, test whether labels remain readable around 8–10 pt in the exported figure, with secondary annotations no smaller than necessary. Use one sans-serif family unless mathematical notation requires another typeface. Keep line widths and arrowheads visible after reduction; approximately 0.75–1.25 pt can be tested as a starting range, but the correct choice depends on the figure size and output medium.
Export vector formats such as PDF or SVG when the submission or presentation workflow supports them, because text and lines remain sharp when scaled. If raster output is required, inspect it at final dimensions instead of judging only a zoomed-in canvas. Embed or outline fonts when appropriate, check for clipped labels, and print a grayscale test. Exact resolution, font, file format, and column-width requirements vary by venue, so 以官方指南为准。
- Use short, parallel labels such as “Conv 3×3,” “LayerNorm,” and “Global Avg Pool.”
- Align boxes to a grid and keep equal gaps between repeated stages.
- Reserve saturated colors for the proposed contribution or the most important path.
- Check contrast, grayscale readability, and color-blind accessibility.
- Open the exported file independently to confirm that fonts, arrows, and transparency render correctly.
7. Choose a workflow: code, manual drawing, or AI generation
Code-based generation is effective for repeated structures, consistent spacing, and architectures that change frequently. PlotNeuralNet uses LaTeX/TikZ to produce neural-network figures and is useful for programmable layouts. NN-SVG is a web-based tool for generating neural-network illustrations. Code generation offers reproducibility and makes global styling changes easier, but custom branches and publication-specific adjustments may require additional layout work.
Manual drawing gives the author direct control over alignment, labels, legends, and unusual data paths. draw.io is a general diagramming tool suitable for arranging boxes, arrows, connectors, and grouped modules. Netron is a model structure viewer that can help inspect supported model graphs and operation names, but a raw computational graph is rarely a finished paper figure. Use it to verify the architecture, then simplify the result into a reader-focused explanation. For hosted editions, optional services, prices, or usage quotas associated with any tool, 以官网为准。
AI generation can help create a first composition from a structured prompt, especially for teaching slides or early drafts. However, it may produce incorrect labels, inconsistent dimensions, impossible connections, or attractive shapes that do not match the implemented model. Treat AI output as an editable sketch rather than architectural evidence. Rebuild critical labels and connectors in a controllable editor, compare the diagram with code or a model summary, and perform a layer-by-layer technical review before publication.
- Choose code generation when reproducibility and repeated structures are the priorities.
- Choose manual drawing when the architecture has custom branches or strict composition needs.
- Use a model viewer to inspect and verify, not as a substitute for visual simplification.
- Use AI generation for ideation or layout drafts, then manually validate every operation and dimension.
- Save the editable source, exported vector file, fonts, legend definitions, and a version tied to the final model checkpoint.
Perguntas sobre este diagrama
How do I draw a neural network architecture diagram for a research paper?
Start with the input-to-output operation sequence, group routine layers, and expand the proposed component. Add tensor shapes at major transitions, use consistent symbols, and export a vector version when the venue accepts it. Check all submission-specific requirements with the official guide: 以官方指南为准。
Should I show every layer in my CNN architecture diagram?
Usually not. Combine repeated or routine operations into labeled blocks, but preserve layers whose order, parameters, or connections are necessary to reproduce or understand the method. You can expand one representative block and mark its repetition with “×N.”
What tensor dimension order should I use in a network diagram?
For CNNs, common labels use channels×height×width, such as 64×56×56, or H×W×C. Either is acceptable if it is used consistently and defined in the legend or caption. For sequence models, symbolic notation such as B×L×D is useful when the sequence length varies.
What is the best tool for making a neural network diagram?
The best choice depends on the workflow: PlotNeuralNet supports LaTeX/TikZ-based generation, NN-SVG provides web-based network illustrations, Netron helps inspect model structures, and draw.io supports manual diagramming. AI generation can accelerate early drafts, but its output must be checked against the actual model. Any price or usage quota is 以官网为准。