IMRAD Format: A Section-by-Section Writing Guide
The IMRAD format gives researchers a practical way to turn a study into a readable scientific argument. IMRAD is an abbreviation for Introduction, Methods, Results, and Discussion. It is the standard structure for most empirical journal articles, while the abstract and references usually sit outside it. The Methods section must be reproducible; the Results section reports findings without interpretation; and the Discussion explains meaning, limitations, and future work. Specific word counts and formatting must follow the target journal’s guidelines and must not be invented.
This structure works because each section answers a different reader question. The Introduction asks why the study was needed. The Methods explain what was done. The Results show what was found. The Discussion explains what the findings mean. When these jobs are mixed—for example, when interpretations appear in Results or new methods appear in Discussion—readers must reconstruct the logic themselves, and reviewers often see the manuscript as poorly controlled.
The guide below is designed for graduate researchers preparing manuscripts, students completing research assignments, and teachers creating scientific-writing lessons or slides. It covers section-level questions, drafting order, visual choices, planning ratios, and frequent reviewer objections. Treat the numerical ratios as workflow aids rather than universal publication rules, and always check the official instructions for your target journal or course.
1. Plan the IMRAD Format Before Drafting
Before writing paragraphs, reduce the paper to four one-sentence answers. State the unresolved problem, describe the study design, name the main finding, and explain its significance. This creates a compact logic chain: need, action, evidence, meaning. If one sentence does not connect to the next, the manuscript probably has a scope problem that prose alone will not fix.
For internal planning, you can divide the main-text allowance into a provisional ratio of 15:30:25:30 for Introduction, Methods, Results, and Discussion. This is a planning reference, not a publication requirement. A descriptive field study may need more Methods space, while a short experimental report may devote more space to Results. Recalculate only after checking the target journal’s official word limit and section instructions.
Build a content matrix before drafting. Give every research question a row, then add columns for the method that tests it, the result that answers it, the figure or table that displays the evidence, and the discussion point supported by that evidence. This simple alignment check prevents orphan methods, unreported outcomes, and discussion claims with no corresponding result.
- Introduction: Why was this study necessary?
- Methods: Exactly how was the study conducted and analyzed?
- Results: What did the planned analyses or observations find?
- Discussion: What do those findings mean, and where are their limits?
- Visual plan: Which diagram, chart, image, or table communicates each step most efficiently?
2. Introduction: Establish the Need and Objective
In the IMRAD format, the Introduction should move from context to a precise research need. A reliable sequence is: define the topic, summarize only the background needed to understand the problem, identify the unresolved gap, explain why the gap matters, and finish with the study objective or research question. If hypotheses were specified, place them near the end so readers know what the study was designed to test.
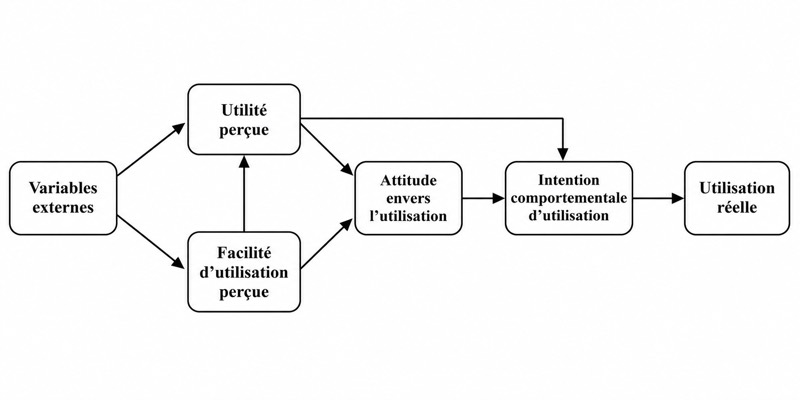
A useful Introduction figure is a conceptual overview, system diagram, gap map, or simplified model of the problem. It should help readers understand relationships that would otherwise require a long verbal explanation. Do not use a decorative illustration that merely repeats the opening paragraph. Labels, variables, populations, and arrows in the figure must use the same terminology as the manuscript.
Reviewers frequently criticize Introductions that are broad but never identify a testable gap. Other common problems include an unsupported claim of novelty, excessive literature summary, objectives that do not match the reported analyses, and citations that establish a topic’s popularity without establishing a real research need. Audit the final paragraph carefully: every objective introduced there should have a corresponding method and result.
- Open with the specific research area rather than a universal claim such as a topic being important worldwide.
- Group prior studies by finding, approach, or disagreement instead of listing one paper per sentence.
- Write the gap as something unknown, inconsistent, untested, or methodologically unresolved.
- End with the objective, research question, or hypothesis—not a second literature review.
- Consider a conceptual figure when readers need a model before they can understand the study design.
3. Methods: Make the Study Reproducible
The Methods section must be reproducible. Its job is to let a qualified reader understand how the evidence was produced and, where feasible, repeat the work. A common order is study design, setting or data source, participants or samples, eligibility criteria, materials, variables, procedures, controls, outcome measures, and statistical or computational analysis. Ethics, consent, registration, or data-governance information should be included where relevant and where required by the official guidelines.
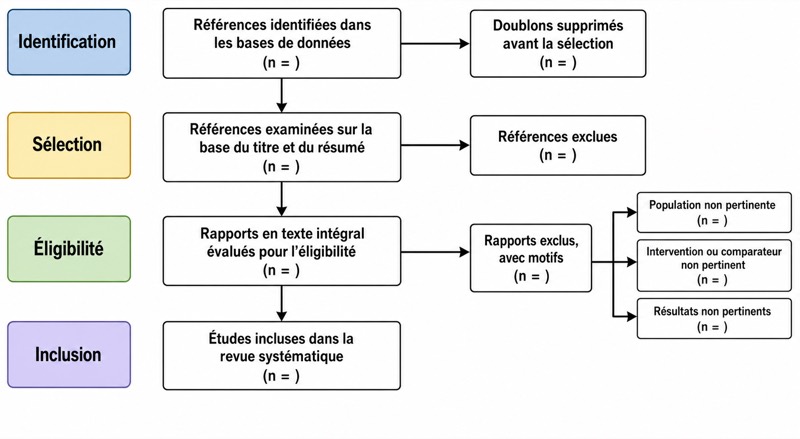
Methods visuals should clarify sequence, structure, or physical arrangement. Suitable options include a study flowchart, sampling diagram, experimental setup, processing pipeline, protocol timeline, or labeled schematic of an instrument. Use arrows consistently, define abbreviations in the caption or legend, and distinguish inputs, transformations, exclusions, and outputs. A diagram should supplement the reproducible details in the text, not hide missing parameters behind a polished image.
Reviewer objections often focus on omitted decision rules: how sample size was determined, how cases were included or excluded, whether allocation or blinding was used, how missing data were handled, which outcomes were primary, and why a statistical test was appropriate. Report the relevant software, version, thresholds, units, parameters, and preprocessing decisions when they affect reproducibility. The exact reporting checklist and level of detail depend on the discipline and journal, so use the official guidance rather than assuming one standard fits every study.
- Use chronological order for procedures unless a design-based order is clearer.
- Define the population, sample, comparison groups, controls, and observation period.
- State enough parameter detail for another researcher to reproduce the procedure.
- Explain analysis choices, assumption checks, exclusions, and data transformations.
- Create a workflow diagram when the procedure has multiple branches, filters, or repeated stages.
4. Results: Report Findings Without Interpretation
The Results section reports findings without interpretation. Organize it by research question, hypothesis, experiment, or analysis—not by the order in which you happened to process the data. Begin each subsection by reminding the reader what was examined, then report the relevant finding and direct the reader to the supporting figure or table. Reserve explanations of meaning, mechanism, importance, and broader implications for the Discussion.
Results visuals carry evidence. Use plots for comparisons, distributions, changes, relationships, and uncertainty; tables for values that readers may need to retrieve precisely; images for spatial, morphological, or observational evidence; and flow diagrams for counts through a study process. Figure titles, axes, legends, units, group names, sample definitions, and panel labels must agree with the text. Captions should allow readers to understand what was measured and compared without searching through several pages.
Common reviewer complaints include selective reporting, inconsistent sample sizes, missing uncertainty, unexplained exclusions, mismatched numbers across text and figures, and claims that are stronger than the displayed data. Another frequent problem is narrating every cell of a table. Use the prose to identify the result relevant to the research question, while allowing the table or figure to hold the full numerical detail.
- Present primary or prespecified outcomes before secondary and exploratory findings.
- Report null or unexpected results when they answer a stated question.
- Keep denominators, units, decimal precision, labels, and group order consistent.
- Place statistical evidence next to the specific comparison it supports.
- Avoid causal or mechanistic explanations in Results; those belong in Discussion.
5. Discussion: Interpret Meaning, Limits, and Next Steps
In the IMRAD format, the Discussion explains the meaning of the findings, the study’s limitations, and future work. A practical sequence is: answer the main research question, interpret the strongest results, compare them with relevant prior evidence, consider plausible explanations, identify limitations, describe implications, and close with a proportionate conclusion. The opening should state what the study adds rather than repeat the Results section line by line.
A Discussion figure can synthesize the evidence into a mechanism model, conceptual framework, implication pathway, or future research map. Make a clear visual distinction between directly observed results and proposed explanations. Solid lines can represent supported relationships and dashed lines can represent hypotheses, provided the legend defines that convention. Do not present a speculative model as if it were measured evidence.
Reviewers commonly object when authors infer causation from a design that only supports association, generalize beyond the sampled population, ignore contradictory findings, or describe limitations without explaining their likely effect. Avoid introducing a new analysis or method for the first time in Discussion. A useful limitation statement names the constraint, explains how it may influence interpretation, and states what design or evidence would address it in future work.
- Answer the main question in the first Discussion paragraph.
- Separate evidence-based interpretation from speculation.
- Compare findings selectively with studies that clarify agreement, disagreement, or mechanism.
- Discuss limitations specifically instead of using a generic sentence about sample size.
- End with implications that match the design and evidence, not the importance of the topic in general.
6. Use Methods–Results–Introduction–Discussion Drafting Order
The reading order does not have to be the writing order. A common efficient sequence is Methods, Results, Introduction, and Discussion. Draft Methods while procedural details and analysis decisions are accessible. Draft Results after analyses and figure values are stable. Then write the Introduction to frame the exact question the completed study answers, followed by the Discussion to interpret the finalized evidence.
This order reduces revision caused by an Introduction that promises analyses the paper never reports. It also makes figure planning more efficient: build evidence figures alongside Results, create the workflow diagram from the completed Methods, and design conceptual figures only after the paper’s claims are stable. The title and abstract are often easier to draft last, although they usually sit outside the four IMRAD sections.
Use passes rather than trying to perfect every sentence immediately. In pass one, establish the section structure and insert evidence. In pass two, check alignment among objectives, methods, results, and claims. In pass three, edit transitions, terminology, captions, and citations. In the final pass, apply the target journal’s official formatting and submission requirements.
- Pass 1: Draft Methods from records, protocols, and analysis notes.
- Pass 2: Build Results around finalized figures, tables, and outcome order.
- Pass 3: Write the Introduction around the actual gap and objective.
- Pass 4: Write the Discussion from evidence to meaning, limitations, and future work.
- Pass 5: Prepare the abstract, title, references, and required submission elements.
7. Run a Reviewer-Style Structure and Figure Audit
Read the manuscript as a chain of traceable claims. Highlight each objective in the Introduction, locate the method used to address it, mark the corresponding result, and identify the Discussion paragraph that interprets it. If any link is absent, either add the missing content when supported or narrow the manuscript’s claim. This audit is more useful than polishing isolated sentences before the structure is sound.
Audit the visuals separately. Each figure should have one primary communication goal, readable labels, defined symbols, consistent colors, and a caption that identifies the material, comparison, or process shown. Check the figure at its likely publication or slide size rather than only at full-screen magnification. Accessibility also matters: do not rely on color alone to distinguish groups, and use patterns, shapes, labels, or line styles where appropriate.
Finally, perform a boundary check between sections. Background and the research gap belong in Introduction; reproducible actions belong in Methods; observed findings belong in Results; interpretation, limitations, and next steps belong in Discussion. Some disciplines permit combined sections or specialized headings, but those arrangements must follow the target journal’s official guidelines.
- Does every stated objective have a method, result, and interpretation?
- Can a reader distinguish measured evidence from a proposed mechanism?
- Do captions define abbreviations, symbols, groups, units, and panel labels?
- Are all numbers and labels consistent across prose, tables, and figures?
- Have causal, novelty, and generalizability claims been kept within the evidence?
- Does the manuscript comply with the official journal or course instructions?
Questions sur ce schéma
What is the IMRAD format in a research paper?
IMRAD stands for Introduction, Methods, Results, and Discussion. It is the standard structure for most empirical journal articles, while the abstract and references usually sit outside it. Each section has a separate purpose: need, procedure, findings, and interpretation.
What order should I write the IMRAD sections in?
A practical drafting order is Methods, Results, Introduction, and Discussion. This lets you frame the Introduction around the study actually completed and write the Discussion from finalized evidence. The manuscript is still presented to readers in Introduction–Methods–Results–Discussion order.
How many words should each IMRAD section be?
There is no universal word count for each section. As an internal planning reference, you can begin with a 15:30:25:30 ratio for Introduction, Methods, Results, and Discussion, then adjust it to the study and article type. Specific word counts and formatting must follow the target journal’s official guidelines.
What figures should go in each IMRAD section?
The Introduction may use a conceptual overview; Methods may use a workflow, setup, or sampling diagram; Results should use evidence-focused plots, tables, or images; and Discussion may use a clearly labeled synthesis or proposed mechanism. Every figure must serve a specific communication purpose and must not overstate the evidence.