Free Miro Alternatives for Scientific Collaboration
The best free Miro alternatives are not simply products with the longest feature lists. A graduate student organizing a literature review, a teacher annotating slides, and a research team mapping hypotheses need different kinds of canvases. Before choosing, identify the artifact you must produce: a temporary discussion board, a persistent knowledge map, a paper-ready figure, or a formal process diagram. That distinction matters more than the number of templates advertised on a pricing page.
Free tools also come with different kinds of costs. A free tier may restrict editable files, collaborators, storage, version history, administrative controls, or export options. Exact quotas and prices change, so 以官网为准. Open-source software removes some licensing constraints, but self-hosting requires setup, maintenance, backups, security updates, and someone responsible for access control. Meanwhile, an offline desktop application may be more useful than a cloud collaboration feature if your lab works with confidential data or unreliable internet.
This guide compares realistic choices by scenario rather than declaring one universal winner. It covers classroom collaboration, research-group brainstorming, paper framework diagrams, and flowcharts. It also explains how to test privacy and offline behavior, how to avoid migration traps, and when an online whiteboard is the wrong category of tool for scientific communication.
How to Evaluate Free Miro Alternatives
Start with a representative task, not a blank account. Create a small test board containing six notes, two connector types, one imported image, a short citation, and a simple hierarchy. Invite one other person, edit simultaneously, close the browser, reconnect, and export the result. This 15-minute exercise reveals more than a feature matrix because it tests the exact path your class or research group will use.
Assess three layers separately. The creation layer covers drawing speed, connectors, text handling, alignment, and image placement. The collaboration layer covers invitations, permissions, comments, cursors, and recovery from accidental edits. The output layer covers whether an exported or printed result remains legible at its intended size. A tool can be excellent for live discussion but poor for producing a stable figure.
For every free plan, inspect the current official terms before committing a semester or research project. Check editable-file limits, guest access, collaborator rules, storage, revision history, export controls, and what happens when a team exceeds the free allowance. Do not assume that a limitation mentioned in an older review still applies; all prices and quotas are 以官网为准.
- Run the same test on no more than three candidates to avoid evaluation fatigue.
- Ask every participant to test from the device they will actually use, including school-managed laptops or tablets.
- Export one sample at the final presentation or print size and inspect small text at 200% zoom.
- Confirm who owns the workspace and how files can be transferred if that person graduates or leaves the institution.
Best Options for Classroom Collaboration
For live teaching, ease of entry is usually more important than advanced diagramming. Students should be able to open the board, understand where to write, and complete a task without spending the first ten minutes learning the interface. FigJam is Figma's whiteboard product and has a free tier. Microsoft Whiteboard comes with Microsoft 365, which can make it convenient where an institution already manages Microsoft accounts. Availability, administrative settings, and current plan conditions are 以官网为准.
OpenBoard is an open-source teaching whiteboard and is especially relevant when the instructor presents from a classroom computer or interactive display. Its teaching orientation is different from a cloud-first brainstorming space, so evaluate remote participation separately if students must edit simultaneously from home. Google Jamboard should not be selected for a new course because Google Jamboard stopped service at the end of 2024.
Design the activity so the tool does not become the lesson. Prepare one locked or clearly separated instruction area, then create one workspace per group. Use a simple convention such as blue for evidence, yellow for questions, and red for unresolved disagreement, while also labeling categories in text so meaning does not depend on color alone. At the end, ask each group to export or submit a summary outside the board; otherwise, useful reasoning may remain trapped in a crowded canvas.
- For a seminar: assign one evidence note and one question note per student before discussion.
- For a lecture: duplicate a prepared region for each group instead of asking students to arrange the canvas themselves.
- For homework: provide a file-naming convention and a submission route that does not depend on a public link.
- Before class: test guest access, keyboard use, contrast, and mobile behavior with a non-instructor account.
Research-Group Brainstorming and Literature Mapping
Research brainstorming benefits from speed, ambiguity, and visible relationships. Excalidraw is open source, has a hand-drawn style, and can be self-hosted. That informal visual language works well for provisional hypotheses, experimental alternatives, and rough system models because participants are less likely to treat every box as final. tldraw is also an open-source whiteboard and is another candidate for flexible spatial thinking. Hosted-service terms and deployment choices can differ, so current conditions are 以官网为准.
A productive lab session should create more than a wall of notes. Divide a 45- to 60-minute meeting into three phases: individual contribution, clustering, and decision. During clustering, label relationships explicitly with phrases such as supports, contradicts, measures, or depends on. During the decision phase, convert clusters into named actions, owners, and unresolved questions. The times are workflow suggestions, not product limits.
Keep the raw board as a record, but create a second, cleaned artifact after the meeting. A useful research workflow has three outputs: the untouched brainstorming board, a curated concept map, and a short decision log. Put full citations in a reference manager or structured document rather than relying on tiny text pasted into notes. Whiteboards are strong spatial indexes, but they are weak substitutes for searchable bibliographic records.
- Assign a facilitator to manage time, a scribe to normalize labels, and a reviewer to check the final decision log.
- Use stable identifiers such as P01 for papers, H02 for hypotheses, and E03 for experiments.
- Separate observations from interpretations so a visual cluster does not imply stronger evidence than the source provides.
- Archive a dated export after major meetings, especially before reorganizing a large board.
Paper Frameworks and Publication Figures
Whiteboards are useful for planning a paper's argument. Create one card per claim, place supporting evidence beneath each claim, and connect every major conclusion to the result or citation that justifies it. If a section has many notes but no clear claim, it may be descriptive rather than argumentative. If a conclusion has no incoming evidence, the board has exposed a structural gap before drafting begins.
For structured framework diagrams, draw.io, also known as diagrams.net, is free and has an offline desktop version. It is generally a better category of tool than a free-form whiteboard when you need deliberate shapes, stable connectors, and repeatable layout. Its interface may feel less spontaneous during brainstorming, but that constraint can become an advantage when converting a rough model into a controlled diagram.
Do not assume that a board export is ready for journal submission. Check text size, line weight, contrast, font consistency, panel order, and whether labels remain readable at the final printed dimensions. Export requirements, accepted formats, resolution expectations, color rules, and accessibility instructions vary by venue; 以官方指南为准. Keep an editable source file and document any fonts, icons, or external assets used.
- Stage 1: sketch the argument quickly on a whiteboard without polishing alignment.
- Stage 2: remove duplicated concepts and rewrite labels as concise scientific statements.
- Stage 3: rebuild the approved structure in a precise diagram or illustration environment.
- Stage 4: test the figure in grayscale and at its expected final size before submission.
Flowcharts, Methods, and Reproducible Workflows
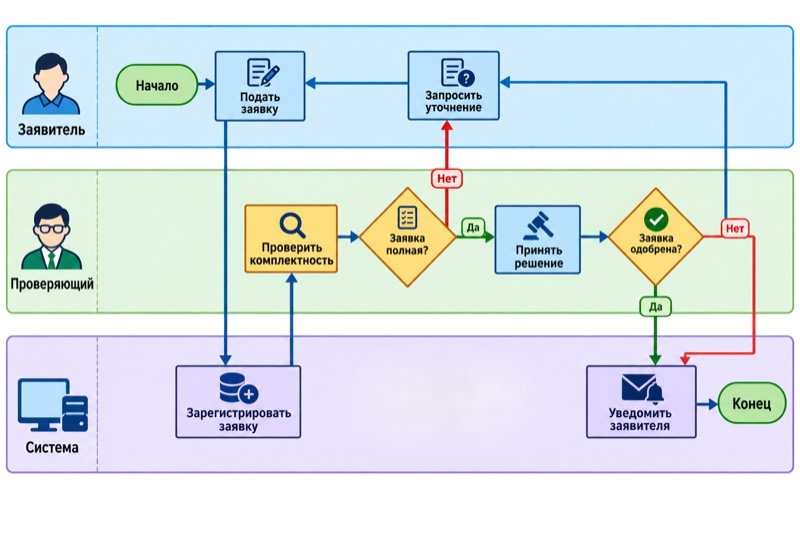
Flowcharts require more semantic discipline than brainstorming boards. Before drawing, define what each shape means in your project. For example, use one convention for actions, another for decisions, and a separate visual treatment for data or outputs. The exact notation can be simple, but it must remain consistent. A legend is valuable when a chart will be read outside the team that created it.
draw.io/diagrams.net is a practical free option for structured process diagrams and can be used through its offline desktop version. Lucidspark has a limited free tier and may suit teams that prefer a facilitated whiteboard environment, but free-plan restrictions can change; prices, quotas, and collaboration limits are 以官网为准. FigJam, Excalidraw, tldraw, and Microsoft Whiteboard can also support early process mapping, but you should test whether the resulting layout is controlled enough for your final use.
For experimental methods, create two linked diagrams rather than forcing everything into one canvas. The first should show the conceptual sequence a reader needs to understand. The second can record operational details such as file transitions, quality checks, decision points, and failure recovery. Number the major steps and use the same identifiers in protocols, code comments, or supplementary documents. This makes the visual map easier to audit without turning it into unreadable documentation.
- Write each process box as a verb plus an object, such as Filter reads or Compare groups.
- Phrase decision nodes as questions with clearly labeled outgoing paths.
- Show where data enters, where it is transformed, and where an irreversible choice occurs.
- Ask a colleague who did not create the chart to explain it back to you; revise any step they interpret incorrectly.
Offline Work, Privacy, and Data Governance
Offline capability matters when fieldwork, classrooms, secure facilities, or unstable networks make cloud access unreliable. The offline desktop version of draw.io/diagrams.net is a direct option for local diagram editing. Excalidraw can be self-hosted, which may give an institution more control over deployment, while tldraw is an open-source whiteboard that can be evaluated for custom deployment. Open source, however, does not automatically guarantee privacy or regulatory compliance.
Before uploading research material, classify it as green, yellow, or red. Green material is already public, such as published citations. Yellow material may include unpublished hypotheses, draft results, or internal comments. Red material may include identifiable participant information, confidential partner data, credentials, or restricted records. Keep red data off a general-purpose board unless your institution has explicitly approved the platform and configuration.
When comparing free Miro alternatives for sensitive work, review more than the privacy-policy headline. Determine where files are stored, who can invite guests, whether public links can be disabled, how deletion works, and whether administrators can recover or export content. Institutional, legal, ethics-board, and funder requirements vary, so 以官方指南为准. If answers are unclear, use anonymized labels on the board and keep the identifying key in an approved system.
- Test whether the tool actually opens, edits, saves, and exports with the network disconnected.
- Store a local archival export after each milestone and verify that the file can be reopened.
- Use project codes instead of participant names, email addresses, medical details, or confidential sample identifiers.
- For self-hosting, assign responsibility for updates, authentication, backups, monitoring, and incident response.
When a Whiteboard Is the Wrong Tool
An online whiteboard is optimized for exploration. It is not automatically the best environment for a final scientific schematic, a publication figure, a precise flowchart, or a reusable methods illustration. If you spend more time aligning objects than clarifying the science, the project has probably moved beyond the brainstorming stage. Likewise, if every edit breaks connectors or text placement, you need a more structured diagram environment.
A dedicated scientific diagram tool is preferable when visual elements must use consistent geometry, repeated styling, controlled labels, layered organization, or reliable output. It is also useful when several figures must share the same visual language across a thesis, paper, poster, or slide deck. For formal publication, verify file and figure requirements with the target journal or institution; 以官方指南为准.
Use a handoff rule to prevent endless polishing in the board. Move to a specialized tool when the team has agreed on the message, the major elements, and the relationships among them. Freeze a dated board export, list the labels that must remain unchanged, and rebuild the figure using a defined grid and style guide. The board remains the reasoning record; the dedicated tool becomes the production environment.
- Stay with a whiteboard for divergent thinking, group voting, clustering, and early argument mapping.
- Move to a structured diagram tool for stable connectors, repeatable layouts, and formal process charts.
- Move to a scientific schematic tool for domain-specific visual explanation and consistent figure production.
- Use presentation software only when the figure is simple and its final destination is primarily a slide deck.
Вопросы об этой схеме
What is the best free Miro alternative for students?
There is no single best choice. FigJam may suit collaborative coursework, Excalidraw can support fast informal sketching, and draw.io/diagrams.net is useful for structured diagrams with an offline desktop option. Free-plan limits and account requirements change, so 以官网为准.
Which free Miro alternative works offline?
draw.io/diagrams.net has an offline desktop version. A self-hosted Excalidraw deployment may also reduce dependence on a third-party cloud service, but installation, authentication, updates, and backups still require planning.
Can I use a free online whiteboard for a research paper figure?
You can use one to plan the argument and sketch the composition. For the final figure, check label consistency, output quality, dimensions, and accepted formats, then rebuild it in a more precise tool if necessary. Journal requirements vary, so 以官方指南为准.
Is an open-source whiteboard automatically private?
No. Open source describes access to the software's source code, not the security of a particular deployment. Privacy depends on hosting, configuration, authentication, logs, backups, updates, user behavior, and institutional approval.