AI Scientific Illustration Tools: What Works Now
AI scientific illustration tools can now produce polished-looking diagrams in minutes, but visual polish is not the same as scientific accuracy. For graduate students preparing papers, students completing assignments, and teachers building lecture slides, the useful question is no longer whether AI can make an image. It is whether the model can make the right type of image, preserve the intended scientific relationships, and produce an output that is safe to use in a particular context.
The short answer is conditional. AI is already useful for conceptual schematics, process diagrams, visual metaphors, and early layout exploration. It remains unreliable for exact anatomy, quantitative plots, molecular structures, scale-dependent representations, and any figure in which a small visual error changes the scientific claim. This guide separates those categories, explains current publication-policy constraints, provides a detailed verification checklist, and gives a practical workflow from prompt writing to final submission.
Where AI scientific illustration tools are reliable
The strongest use case is a conceptual figure whose purpose is to explain relationships rather than document exact measurements. Examples include a simplified cell signaling overview, an ecological nutrient-cycle diagram, a laboratory workflow, or a high-level illustration of how a sensor detects a target. In these cases, an AI model can rapidly explore composition, color hierarchy, visual style, and the placement of major components. It is particularly useful before manual drawing because it helps the author compare several layouts without spending hours on each draft.
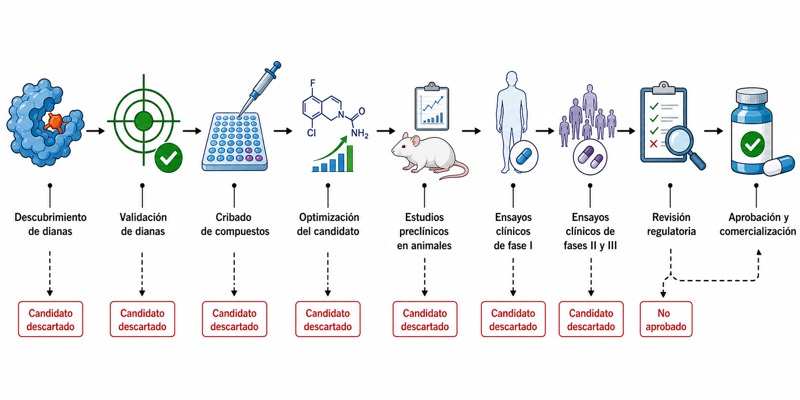
AI is also effective for process flows when the author supplies the sequence explicitly. A five-stage experimental pipeline—sample collection, preparation, measurement, analysis, and interpretation—can be converted into a visual draft with consistent icons and directional flow. However, text rendered inside generated images is often misspelled, duplicated, or semantically wrong. A safer method is to generate the visual components without text, then add every label manually in a vector, slide, or page-layout editor.
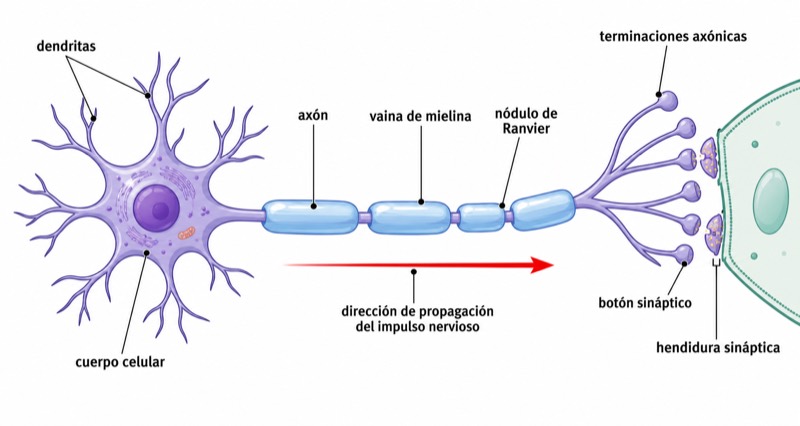
Annotated educational images are another practical category, provided that annotation is treated as a separate human-controlled layer. A teacher might generate a simplified cross-section of a leaf, an overview of a bioreactor, or a conceptual landscape showing water movement. The final arrows, names, legends, scale statements, and explanatory callouts should be added or corrected manually. This division of labor uses AI for visual construction while keeping scientific language under direct control.
- Good candidates: conceptual mechanisms, simplified pathways, experimental workflows, graphical abstracts, poster backgrounds, and teaching schematics.
- Prefer relationships such as A activates B or material moves from chamber 1 to chamber 2 over requests for exact geometry.
- Generate unlabeled or minimally labeled artwork when possible; add terminology, symbols, units, and captions manually.
- Ask for a clean, flat, editable-looking composition with separated components rather than a dense photorealistic scene.
- Use AI output as a draft whenever the figure will support a scientific claim rather than merely provide decoration.
Where AI scientific illustration tools still fail
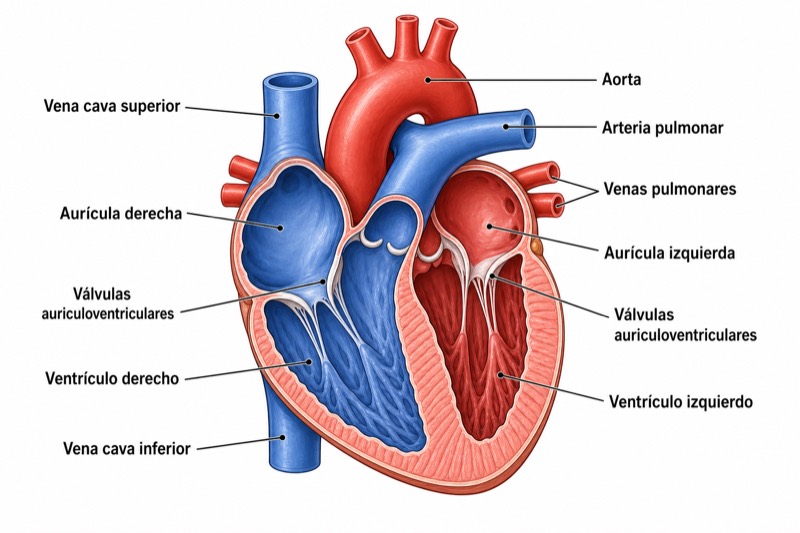
Real anatomical detail remains a high-risk application. A generated organ, tissue layer, surgical field, or microscopic structure may look convincing while containing impossible branching, fused structures, missing landmarks, incorrect orientation, or inconsistent spatial relationships. This is especially dangerous because viewers tend to trust realistic rendering. If anatomical identity, pathology, laterality, or procedural guidance matters, the figure should be built from verified references and reviewed by a qualified subject expert.
Quantitative data visualization is another unsuitable target. A generative image model may draw a plausible bar chart, scatter plot, heat map, or survival curve, but it does not reliably preserve the underlying values. It may alter bar heights, invent axis intervals, duplicate points, change error bars, or create trends that were not present in the data. Generate scientific plots from the actual dataset with statistical or plotting software. AI may help suggest a chart type or improve a layout plan, but the final marks must remain traceable to data and code.
Chemical structures, mathematical notation, genetic sequences, and scale-sensitive diagrams require the same caution. Image models can omit a bond, change stereochemistry, create an impossible valence, substitute one atom label for another, or corrupt a superscript. A single incorrect wedge bond can identify a different compound. Use chemistry, sequence, equation, mapping, or engineering software designed to enforce the relevant formal rules, and verify the exported result independently.
- Do not trust AI-generated anatomy for diagnosis, clinical training, surgical instruction, or publication without expert reconstruction and review.
- Do not use pixels from a generated chart as a substitute for plotted source data.
- Do not accept molecular structures unless atom identities, charges, bond orders, stereochemistry, and numbering have been checked.
- Do not infer scale from visual appearance; include a scale bar only when it is derived from known image metadata or measurements.
- Treat realistic scientific imagery as higher risk than obviously simplified illustration because hidden errors are harder to notice.
A risk test before you generate anything
Before choosing a tool, ask what would happen if one component were wrong. A decorative image of a generic laboratory has a low scientific error cost. A pathway figure that reverses an inhibitory arrow has a high error cost. A clinical anatomy image may have an even higher cost because incorrect geometry can mislead readers about a procedure or diagnosis. This error-cost test is more useful than asking whether an image looks professional.
A second test is traceability. Every important element should be linked to a source: experimental data, a protocol, an accepted reference diagram, a specimen image, a database record, or the author's explicitly defined model. If you cannot say where a shape, relationship, label, or value came from, it should not be presented as evidence. Generative output has no automatic authority merely because it resembles a textbook illustration.
A practical way to classify a project is to score four dimensions from low to high: visual exactness, numerical dependence, domain consequence, and publication sensitivity. If two or more dimensions are high, use AI only for brainstorming or styling—not for the scientific content layer. The precise thresholds depend on the discipline and venue, so the official guidelines are authoritative (以官方指南为准).
- Low risk: decorative cover art, generic classroom scenes, nontechnical icons, and early composition sketches.
- Moderate risk: simplified teaching diagrams, conceptual mechanisms, posters, and graphical-abstract drafts that will receive expert review.
- High risk: data figures, anatomy, clinical procedures, chemical structures, device dimensions, maps with exact boundaries, and evidence images.
- Ask whether a reviewer could reproduce or verify the figure from the cited sources and underlying files.
- When uncertain, separate the artwork layer from the evidence layer and create the evidence layer with deterministic software.
Journal policies for AI-generated scientific images
Nature family journals announced in 2023 that they do not accept AI-generated images or videos; textual AI tools must be disclosed. Science family journals during the same period prohibited AI-generated images without editorial permission. Elsevier policy requires authors not to use generative AI to create or modify images, unless AI is itself part of the research method and has been disclosed. Policies continue to change, so check the current author guidelines before submission.
The practical implication is that an image suitable for a lecture is not automatically suitable for a manuscript. General practice is that AI images are relatively safer for teaching, posters, presentations, and first drafts. A figure intended for the main body of a submission requires confirmation of the target journal's policy and item-by-item verification of scientific accuracy. Do not assume that disclosure converts a prohibited use into an acceptable one.
Check policy at three points: before creating the figure, before initial submission, and again before final acceptance or production. Search the journal's current author guidelines for terms including artificial intelligence, generative AI, image integrity, figure preparation, graphical abstracts, and disclosure. If wording is ambiguous, contact the editorial office and retain the response. Requirements, definitions, and permitted exceptions may change; for all current details, the official guidelines are authoritative (以官方指南为准).
- Record the journal name, policy page URL, access date, and the relevant policy text in the project notes.
- Distinguish AI-generated content from ordinary deterministic operations such as cropping, color correction, or plotting data, while following the journal's own definitions.
- Do not use generative fill, object removal, or synthetic extension on research images unless the applicable policy clearly permits it.
- If AI is part of the research method, document the model category, purpose, inputs, processing steps, human checks, and limitations as required by the venue.
- Preserve original files, intermediate versions, prompts, source references, and manually edited final artwork for audit and revision.
The human verification checklist
Verification should be performed at the level of individual claims, not as a quick visual inspection. Start by listing what the figure asserts: which objects exist, where they are located, what connects them, which direction a process moves, and whether size or color carries meaning. Compare each assertion with a trusted source. For a pathway, this means checking every node and arrow. For an apparatus diagram, it means checking every port, tube, sensor, and flow direction.
Next, conduct a separate production review. Inspect labels at normal reading size and at high magnification. Confirm that colors are distinguishable, the legend matches the image, abbreviations are defined, and the panel order agrees with the caption. If color indicates categories or intensity, make sure the mapping is consistent and accessible when printed or viewed by readers with color-vision deficiencies. Remove ornamental details that resemble meaningful symbols.
Finally, ask someone who did not create the figure to interpret it without seeing the prompt. Have that reviewer explain the mechanism or workflow in their own words. If their interpretation differs from the intended message, revise the visual hierarchy or caption. For high-stakes figures, the reviewer should have relevant domain expertise rather than only design experience.
- Scientific content: identities, relationships, directionality, spatial order, causal claims, categories, and omitted exceptions.
- Text: spelling, capitalization, symbols, subscripts, superscripts, Greek letters, abbreviations, nomenclature, and units.
- Quantitative integrity: values, axes, scales, error bars, sample sizes, significant digits, and consistency with the source data.
- Chemical and biological accuracy: bond order, stereochemistry, sequence direction, residue numbering, membrane orientation, anatomy, and cellular localization.
- Visual integrity: duplicated objects, merged structures, impossible shadows, broken boundaries, inconsistent perspectives, and unexplained color changes.
- Accessibility: readable type, sufficient contrast, color-independent distinctions, logical panel order, and a caption that can stand on its own.
- Provenance: source references, data files, generation records, editing history, permissions, disclosures, and the target journal's current policy.
A prompt-to-submission workflow
Begin with a written figure specification rather than a visual-style prompt. Define the audience, purpose, factual components, relationships, reading order, and prohibited elements. For example: create a simplified horizontal diagram for graduate biology students showing sample collection, RNA extraction, library preparation, sequencing, and computational analysis; use five visually separated stages; leave blank spaces for manual labels; do not include numerical results, molecular structures, brand marks, or extra laboratory steps. This gives the model less room to invent content.
Generate several low-detail compositions and select the one with the clearest structure, not the one with the most impressive surface detail. Then compare the chosen draft against the specification. Delete invented objects and regenerate isolated components if necessary. Avoid repeatedly asking the model to repair tiny scientific errors inside a dense image; reconstruction in an editor is usually more controlled than iterative pixel-level correction.
Move the approved draft into a manual production stage. Recreate critical arrows, boundaries, labels, legends, scale indicators, and data-linked elements with appropriate editing, plotting, or domain-specific software. Keep AI-generated artwork on separate layers from text and evidence. Run the scientific and production checklists, obtain an independent review, and compare the final figure with the caption line by line.
Before submission, verify the current policy of the exact journal and article type. Prepare any required disclosure, save editable source files, and export according to the journal's current format, resolution, font, and color instructions. Specific technical requirements differ and may change, so the official guidelines are authoritative (以官方指南为准). If the policy does not permit the generated content, rebuild the figure with conventional illustration methods rather than trying to disguise its origin.
- Step 1: Write a one-paragraph scientific specification and list all facts the figure must communicate.
- Step 2: Collect authoritative references and assign at least one source to every important claim.
- Step 3: Generate two to four rough layout options with minimal or no embedded text.
- Step 4: Select by clarity, then remove invented or ambiguous visual content.
- Step 5: Rebuild labels, arrows, data, structures, and scale-dependent elements manually.
- Step 6: Perform scientific, textual, quantitative, accessibility, and provenance checks.
- Step 7: Obtain review from a colleague or instructor who did not write the prompt.
- Step 8: Check current journal policy, document disclosure if applicable, and archive all source files.
Practical guidance for students, teachers, and researchers
Students should treat generated diagrams as learning aids, not as sources. If an assignment asks for a labeled mechanism, verify the mechanism in course materials and primary or authoritative references before drawing it. Cite the scientific sources that support the content; an image-generation prompt is not evidence. Also check the course's academic-integrity rules, because acceptable use varies by institution and assignment. When rules are unclear, the official course or institutional guidelines are authoritative (以官方指南为准).
Teachers can use AI to create visual variety, simplified scenes, and discussion exercises. One valuable classroom method is to show a plausible generated diagram containing several errors and ask students to identify them using references. For standard teaching slides, keep labels editable and maintain a verified master version so that errors are not copied from one semester to the next. Avoid generated clinical or anatomical detail when learners may mistake it for an authoritative reference.
Researchers gain the most value by using AI early in the design process. It can reduce the time needed to explore compositions, icon styles, and visual narratives, while deterministic tools retain control over evidence. The best mental model is an AI art assistant working under supervision—not an autonomous scientific illustrator. The author remains responsible for accuracy, permissions, disclosure, and compliance regardless of how quickly the first draft was produced.
- For coursework: disclose use when required, cite scientific sources, and verify every label.
- For lectures: prioritize readability, remove decorative clutter, and keep a corrected editable master.
- For posters: use AI for conceptual background or layout exploration, but build results panels directly from data.
- For manuscripts: check policy before generation and again before submission; do not assume that a previous journal's rules apply.
- For all contexts: never use visual realism as a substitute for scientific validation.
Preguntas sobre este diagrama
Can I use AI-generated scientific illustrations in a research paper?
Only if the target journal's current policy allows the specific use and the figure has been fully verified. Some major publishers and journal families prohibit or restrict AI-generated or AI-modified images. Check the exact journal and article type before creating or submitting the figure; the official guidelines are authoritative (以官方指南为准).
Are AI scientific diagrams accurate enough for a thesis?
They can be useful as drafts for conceptual diagrams and workflows, but they should not be accepted without manual checking. Rebuild critical labels, arrows, structures, scales, and data-linked elements using controlled tools. Your institution and eventual publication venue may also require disclosure or impose restrictions.
Can AI make graphs from my research data?
A language model may help write plotting code or suggest an appropriate chart, but a generative image model should not render the final data figure. Produce the graph directly from the source dataset using statistical or plotting software, then verify axes, values, units, error bars, and captions. Keep the data and code so the figure is reproducible.
How do I stop an AI science image from adding wrong labels?
Ask for an unlabeled composition with deliberate blank areas, then add all labels manually in an editor. Keep a separate list of approved terminology, symbols, units, and abbreviations, and compare the finished figure against it. This is more reliable than repeatedly prompting the model to correct embedded text.